Thermogram of a hand holding a hamburger
Bildnummer 11832642
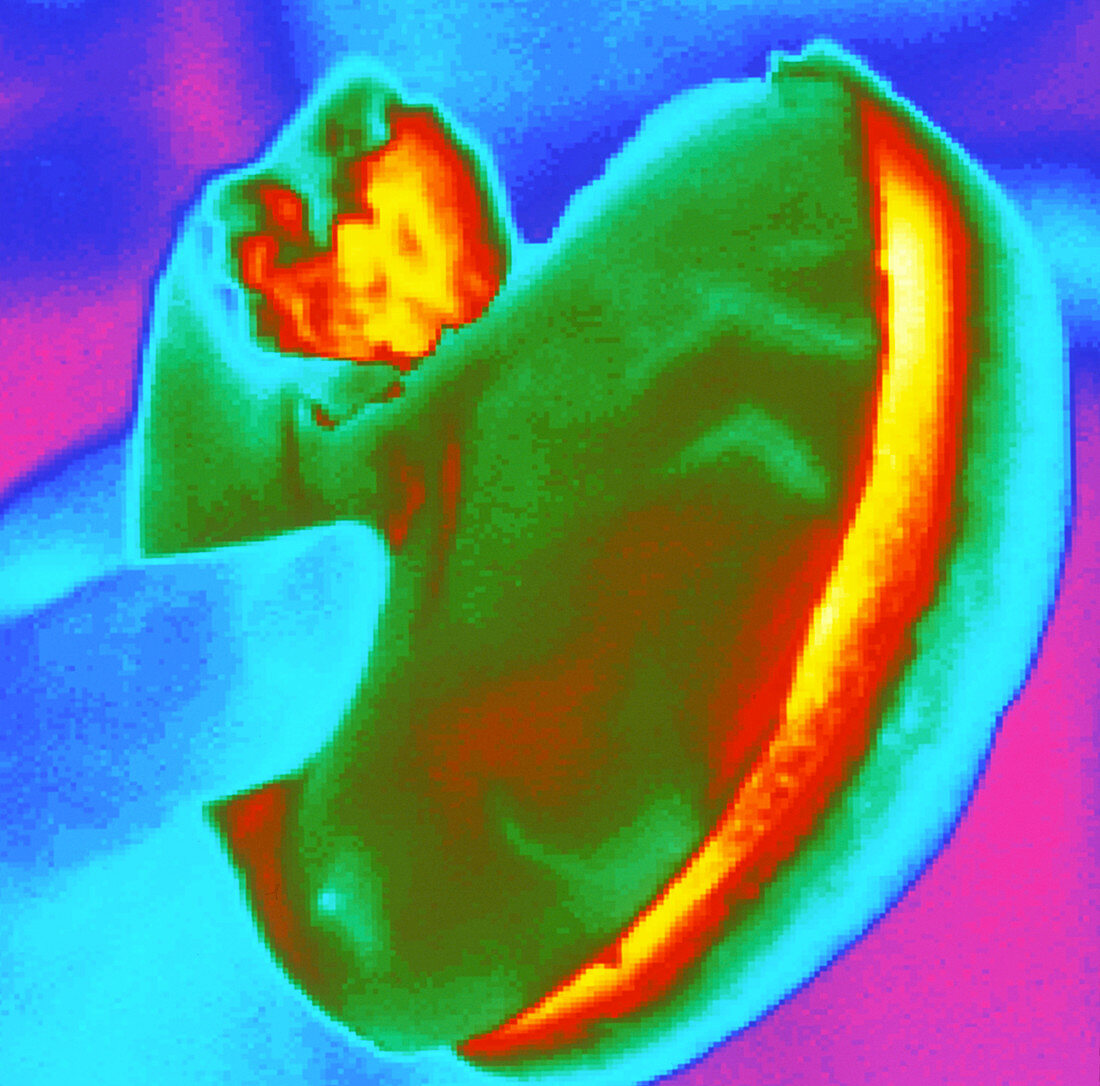
| Hamburger. Thermogram of a hand holding a half- eaten hamburger. The temperature scale runs from red (warmest) through yellow,green,cyan and blue to mauve (coldest). Thermography is a technique for visualising the temperature of surfaces by recording their emission of long-wavelength variation. This heat radiation is detected electronically and displayed with different colours representing different temperatures. In this case the thermogram shows the temperature variations of the surface of the food and the hand holding it. It shows that the meat inside the burger is the hottest part of the food | |
| Lizenzart: | Lizenzpflichtig |
| Credit: | Science Photo Library / Tucker, Dr. Arthur |
| Bildgröße: | 2848 px × 2812 px |
| Modell-Rechte: | nicht erforderlich |
| Eigentums-Rechte: | nicht erforderlich |
| Restrictions: | - |
Preise für dieses Bild ab 15 €
Universitäten & Organisationen
(Informationsmaterial Digital, Informationsmaterial Print, Lehrmaterial Digital etc.)
ab 15 €
Redaktionell
(Bücher, Bücher: Sach- und Fachliteratur, Digitale Medien (redaktionell) etc.)
ab 30 €
Werbung
(Anzeigen, Aussenwerbung, Digitale Medien, Fernsehwerbung, Karten, Werbemittel, Zeitschriften etc.)
ab 55 €
Handelsprodukte
(bedruckte Textilie, Kalender, Postkarte, Grußkarte, Verpackung etc.)
ab 75 €
Pauschalpreise
Rechtepakete für die unbeschränkte Bildnutzung in Print oder Online
ab 495 €