Thermogram of front of office block
Bildnummer 11832632
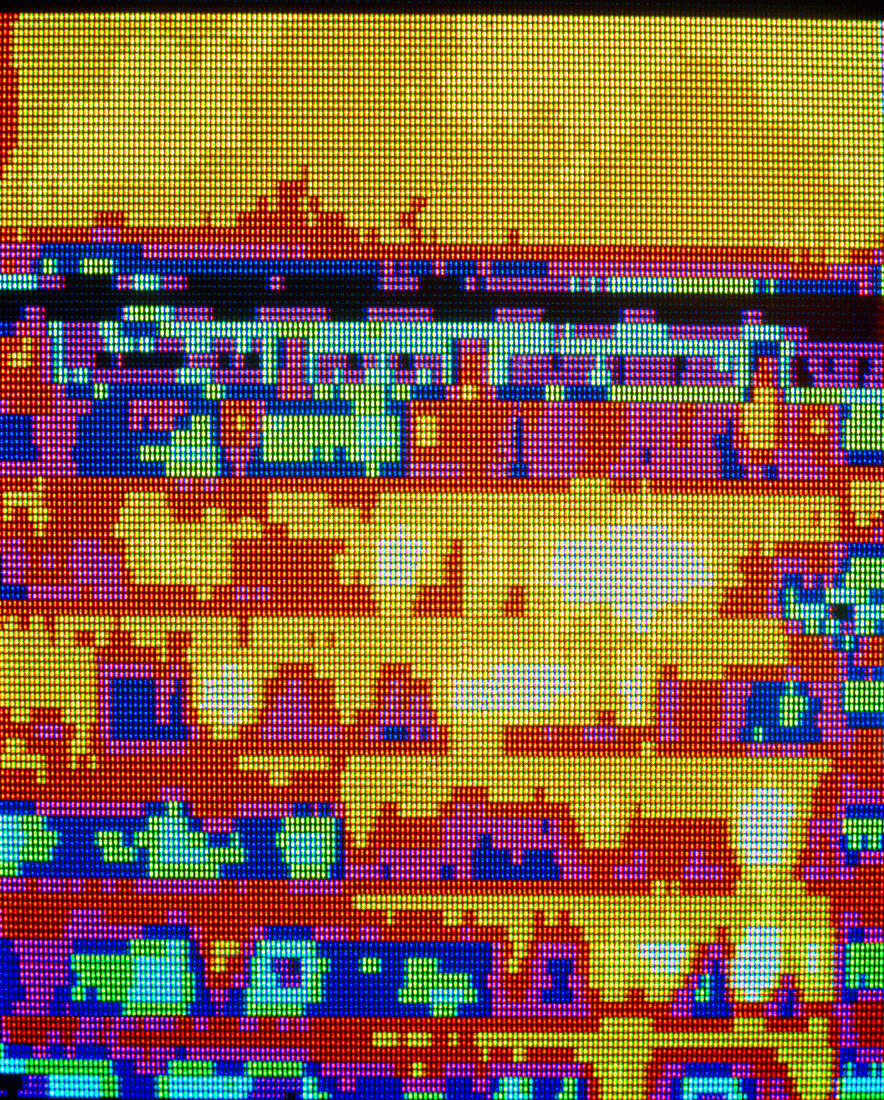
| Thermogram of the front of an office block showing the distribution of temperature across the exterior surface of the building. The colour chart runs from white/yellow the hottest regions through to light green/purple the coldest regions. Much of the building is cool,apearing in light green & purple. Some areas,however,are hot (white & yellow),indicating heat loss through windows. See H584/049 for ordinary 35mm photograph. Original is 6x7cm H584/041 | |
| Lizenzart: | Lizenzpflichtig |
| Credit: | Science Photo Library / Hart-Davis, Adam |
| Bildgröße: | 3788 px × 4713 px |
| Modell-Rechte: | nicht erforderlich |
| Eigentums-Rechte: | nicht erforderlich |
| Restrictions: | - |
Preise für dieses Bild ab 15 €
Universitäten & Organisationen
(Informationsmaterial Digital, Informationsmaterial Print, Lehrmaterial Digital etc.)
ab 15 €
Redaktionell
(Bücher, Bücher: Sach- und Fachliteratur, Digitale Medien (redaktionell) etc.)
ab 30 €
Werbung
(Anzeigen, Aussenwerbung, Digitale Medien, Fernsehwerbung, Karten, Werbemittel, Zeitschriften etc.)
ab 55 €
Handelsprodukte
(bedruckte Textilie, Kalender, Postkarte, Grußkarte, Verpackung etc.)
ab 75 €
Pauschalpreise
Rechtepakete für die unbeschränkte Bildnutzung in Print oder Online
ab 495 €