Recording atmospheric pollution
Bildnummer 11750456
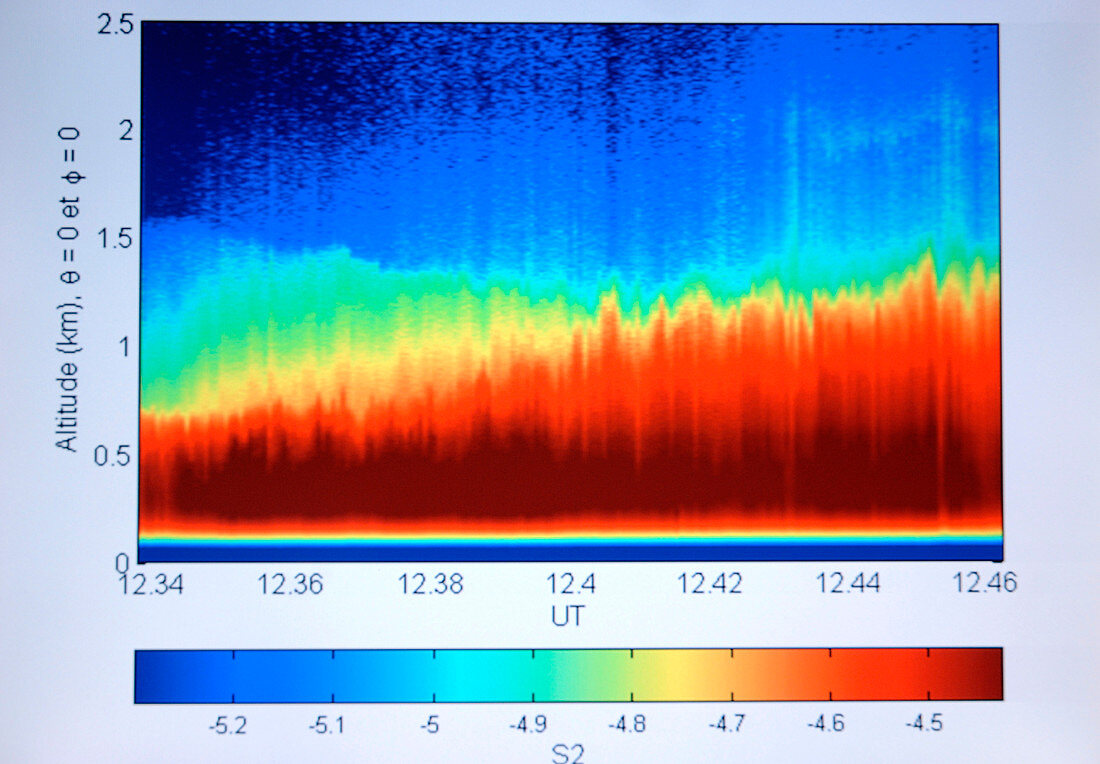
| Recording atmospheric pollution. Results from an experiment using LIDAR (light detecting and ranging) laser equipment to measure atmospheric pollution due to aerosols (microscopic solid particles). The graph shows the presence of larger amounts of aerosols (orange) at altitudes below one kilometre,with the amount decreasing (blue) in the region up to 2.5 kilometres. It also shows the height the pollution is found at increasing with time. Natural examples of aerosols include dust,sand,salt and volcanic ash. Examples from human sources include soot and other particles from the combustion of fossil fuels. Excessive amounts of aerosols can be a health hazard. Photographed on 18 May 2005,in Paris,France | |
| Lizenzart: | Lizenzpflichtig |
| Credit: | Science Photo Library / Plailly, Philippe |
| Bildgröße: | 3573 px × 2481 px |
| Modell-Rechte: | nicht erforderlich |
| Eigentums-Rechte: | nicht erforderlich |
| Restrictions: |
|
Preise für dieses Bild ab 15 €
Universitäten & Organisationen
(Informationsmaterial Digital, Informationsmaterial Print, Lehrmaterial Digital etc.)
ab 15 €
Redaktionell
(Bücher, Bücher: Sach- und Fachliteratur, Digitale Medien (redaktionell) etc.)
ab 30 €
Werbung
(Anzeigen, Aussenwerbung, Digitale Medien, Fernsehwerbung, Karten, Werbemittel, Zeitschriften etc.)
ab 55 €
Handelsprodukte
(bedruckte Textilie, Kalender, Postkarte, Grußkarte, Verpackung etc.)
ab 75 €
Pauschalpreise
Rechtepakete für die unbeschränkte Bildnutzung in Print oder Online
ab 495 €
Keywords
- 21. Jahrhundert,
- Analyse,
- analysierend,
- Asche,
- Atmosphäre,
- Blütezeit,
- Chemie,
- chemisch,
- Computer,
- Daten,
- Erdkunde,
- Ergebnis,
- Europa,
- europäisch,
- Experiment,
- Forschung,
- Frankreich,
- Französisch,
- Hagedorn,
- Laser,
- Luftqualität,
- Messung,
- Meteorologie,
- meteorologisch,
- Paris,
- Partikel,
- Staub,
- Technologie,
- technologisch,
- Überwachung,
- Umwelt,
- Verschmutzung,
- Wetter,
- Zeit