Lidar map of air pollution,particulates
Bildnummer 11750258
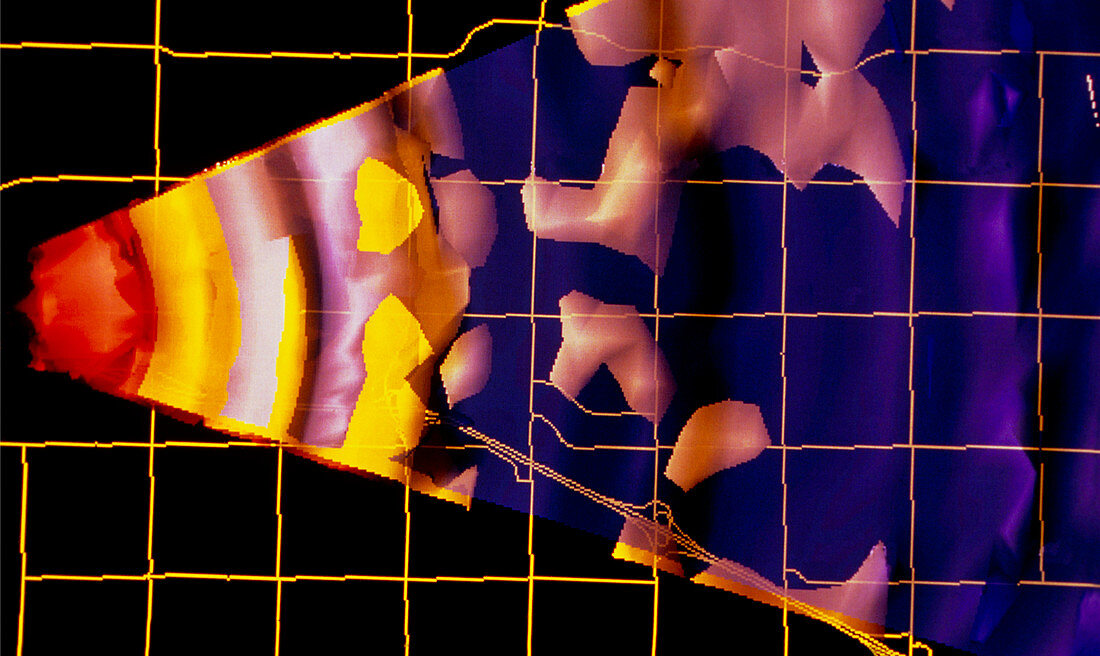
| Lidar map of air pollution. Map showing the density of airborne particulates over Albuquerque,New Mexico,made using a Lidar system. The colours represent the concentration of particulates in the air,from red (highest concentration) through yellow and pale blue to dark blue (lowest). The worst pollution is over a truck refuelling station next to a motorway junction. The yellow lines are roads. Lidar (Light Detection and Ranging) uses a laser to scan an area of sky. A telescope is coupled to the laser,and measures the amount of light scattered by air pollution back to the instrument | |
| Lizenzart: | Lizenzpflichtig |
| Credit: | Science Photo Library / Santa Fe Technologies |
| Bildgröße: | 4978 px × 2969 px |
| Modell-Rechte: | nicht erforderlich |
| Eigentums-Rechte: | nicht erforderlich |
| Restrictions: | - |
Preise für dieses Bild ab 15 €
Universitäten & Organisationen
(Informationsmaterial Digital, Informationsmaterial Print, Lehrmaterial Digital etc.)
ab 15 €
Redaktionell
(Bücher, Bücher: Sach- und Fachliteratur, Digitale Medien (redaktionell) etc.)
ab 30 €
Werbung
(Anzeigen, Aussenwerbung, Digitale Medien, Fernsehwerbung, Karten, Werbemittel, Zeitschriften etc.)
ab 55 €
Handelsprodukte
(bedruckte Textilie, Kalender, Postkarte, Grußkarte, Verpackung etc.)
ab 75 €
Pauschalpreise
Rechtepakete für die unbeschränkte Bildnutzung in Print oder Online
ab 495 €