Use of landsat satellite data to map land
Bildnummer 11749433
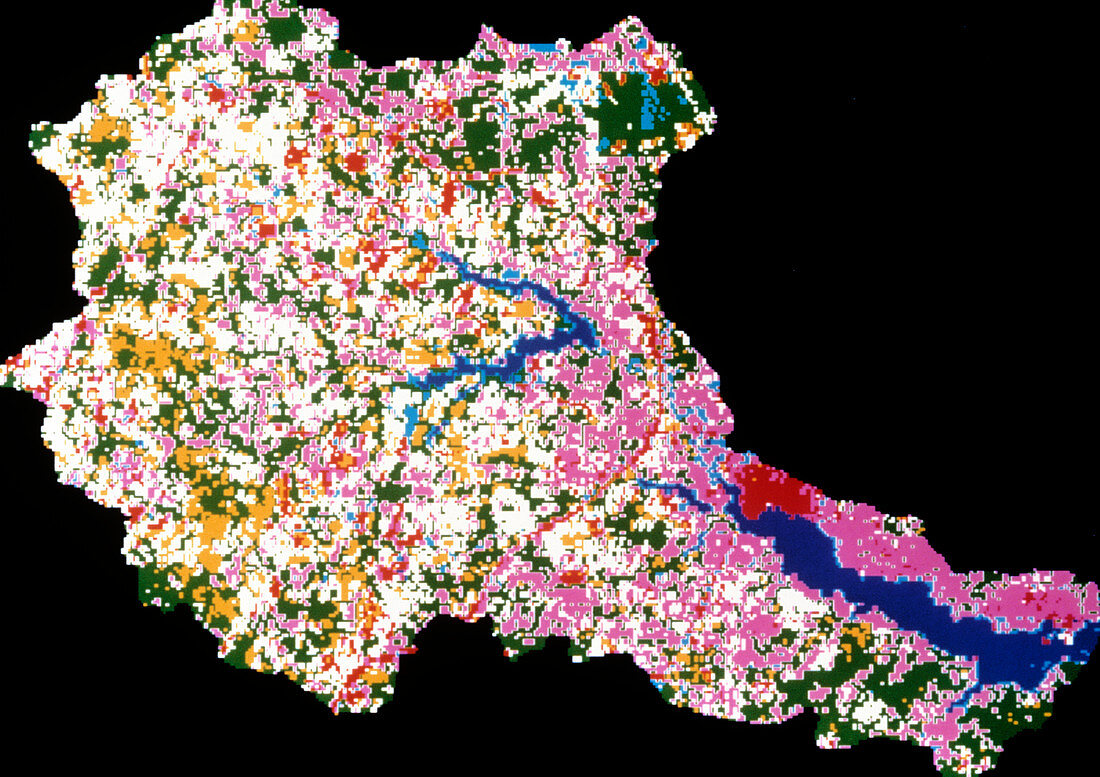
| Example of the use of Landsat satellite data to map land use for planning & pollution control. The map covers the Navesink watershed in the north- east part of the state of New Jersey,in the USA. Red represents high-density urban areas & purple is medium/low-density urban land; blue & aqua are water & wetlands; yellow is cropland,green is forest,& white represents pasture & vacant or barren land. This land use map was used to help determine the effects on water pollution of agricultural & urban activities | |
| Lizenzart: | Lizenzpflichtig |
| Credit: | Science Photo Library / NASA |
| Bildgröße: | 4961 px × 3503 px |
| Modell-Rechte: | nicht erforderlich |
| Eigentums-Rechte: | nicht erforderlich |
| Restrictions: | - |
Preise für dieses Bild ab 15 €
Universitäten & Organisationen
(Informationsmaterial Digital, Informationsmaterial Print, Lehrmaterial Digital etc.)
ab 15 €
Redaktionell
(Bücher, Bücher: Sach- und Fachliteratur, Digitale Medien (redaktionell) etc.)
ab 30 €
Werbung
(Anzeigen, Aussenwerbung, Digitale Medien, Fernsehwerbung, Karten, Werbemittel, Zeitschriften etc.)
ab 55 €
Handelsprodukte
(bedruckte Textilie, Kalender, Postkarte, Grußkarte, Verpackung etc.)
ab 75 €
Pauschalpreise
Rechtepakete für die unbeschränkte Bildnutzung in Print oder Online
ab 495 €