Global map of tropospheric temperature anomalies
Bildnummer 11736334
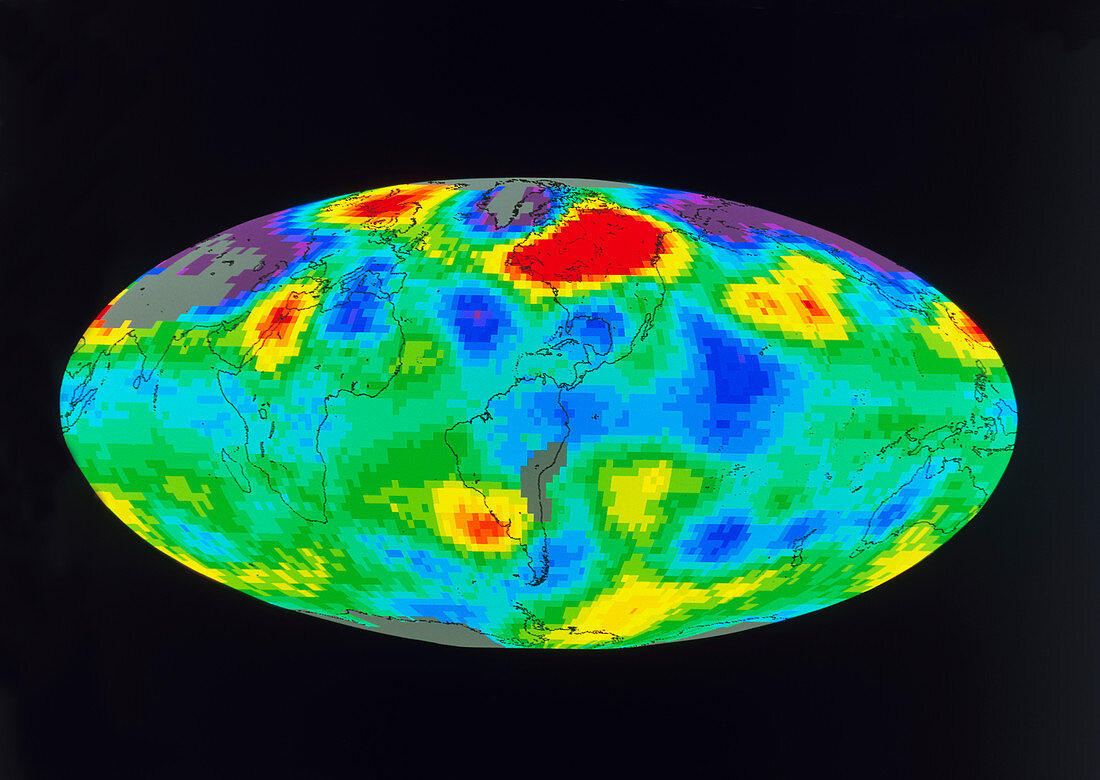
| Global atmospheric temperature anomalies. Colour- coded map of the World,showing the distribution of temperature anomalies in the troposphere in February 1984. Temperature anomalies are defined as deviations from a long-term mean. The colours represent the temperature differences from the mean,coded from red (+2 Celsius) through yellow (+1 C),green (no change),blue (-1 C) to purple (-2 C). February 1984 was unusually warm over Canada,Scandinavia and China but colder than usual over Russia and Greenland. Grey areas indicate missing data. The data were gathered by a microwave sounder on the TIROS-N satellite | |
| Lizenzart: | Lizenzpflichtig |
| Credit: | Science Photo Library / GENE FELDMAN, NASA GSFC |
| Bildgröße: | 5111 px × 3623 px |
| Modell-Rechte: | nicht erforderlich |
| Eigentums-Rechte: | nicht erforderlich |
| Restrictions: | - |
Preise für dieses Bild ab 15 €
Universitäten & Organisationen
(Informationsmaterial Digital, Informationsmaterial Print, Lehrmaterial Digital etc.)
ab 15 €
Redaktionell
(Bücher, Bücher: Sach- und Fachliteratur, Digitale Medien (redaktionell) etc.)
ab 30 €
Werbung
(Anzeigen, Aussenwerbung, Digitale Medien, Fernsehwerbung, Karten, Werbemittel, Zeitschriften etc.)
ab 55 €
Handelsprodukte
(bedruckte Textilie, Kalender, Postkarte, Grußkarte, Verpackung etc.)
ab 75 €
Pauschalpreise
Rechtepakete für die unbeschränkte Bildnutzung in Print oder Online
ab 495 €