Antarctic ozone hole: TOMS comparison 1987-1990
Bildnummer 11736309
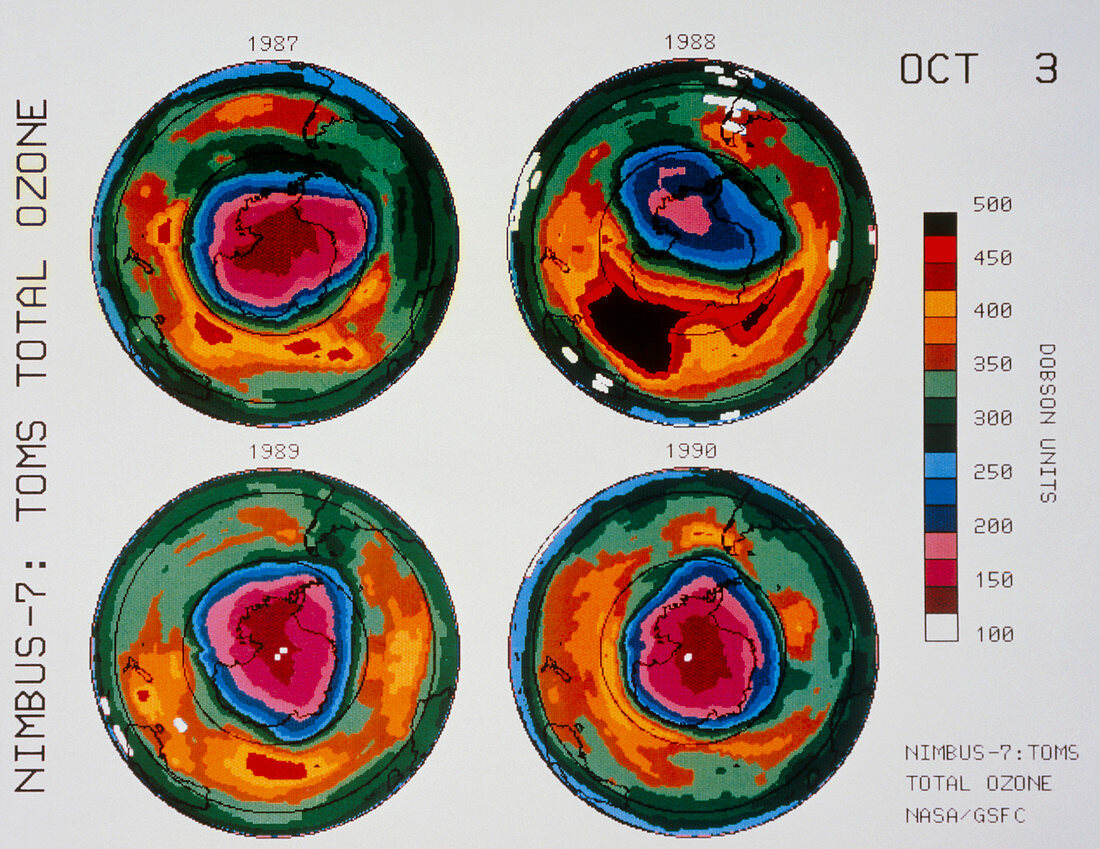
| Series of satellite maps comparing the severe depletion or "hole" in the ozone layer over Antarctica on each 3rd October in the period 1987- 90. First observed in 1980,the hole is believed to be due to pollution of the atmosphere by chlorofluorocarbons (CFCs) used in aerosols & refrigerants. The colour scale at right shows total ozone values (in Dobson Units) - missing data appears white. The hole appears in shades of pink,with Antarctica outlined in black. The size of the hole was similar in 1987,1989 & 1990,whilst in 1988 it was reduced. The map was made by the Total Ozone Mapping Spectrometer (TOMS) on the American Nimbus-7 weather satellite | |
| Lizenzart: | Lizenzpflichtig |
| Credit: | Science Photo Library / NASA |
| Bildgröße: | 4452 px × 3437 px |
| Modell-Rechte: | nicht erforderlich |
| Eigentums-Rechte: | nicht erforderlich |
| Restrictions: | - |
Preise für dieses Bild ab 15 €
Universitäten & Organisationen
(Informationsmaterial Digital, Informationsmaterial Print, Lehrmaterial Digital etc.)
ab 15 €
Redaktionell
(Bücher, Bücher: Sach- und Fachliteratur, Digitale Medien (redaktionell) etc.)
ab 30 €
Werbung
(Anzeigen, Aussenwerbung, Digitale Medien, Fernsehwerbung, Karten, Werbemittel, Zeitschriften etc.)
ab 55 €
Handelsprodukte
(bedruckte Textilie, Kalender, Postkarte, Grußkarte, Verpackung etc.)
ab 75 €
Pauschalpreise
Rechtepakete für die unbeschränkte Bildnutzung in Print oder Online
ab 495 €