Antarctic ozone hole October 1990
Bildnummer 11736307
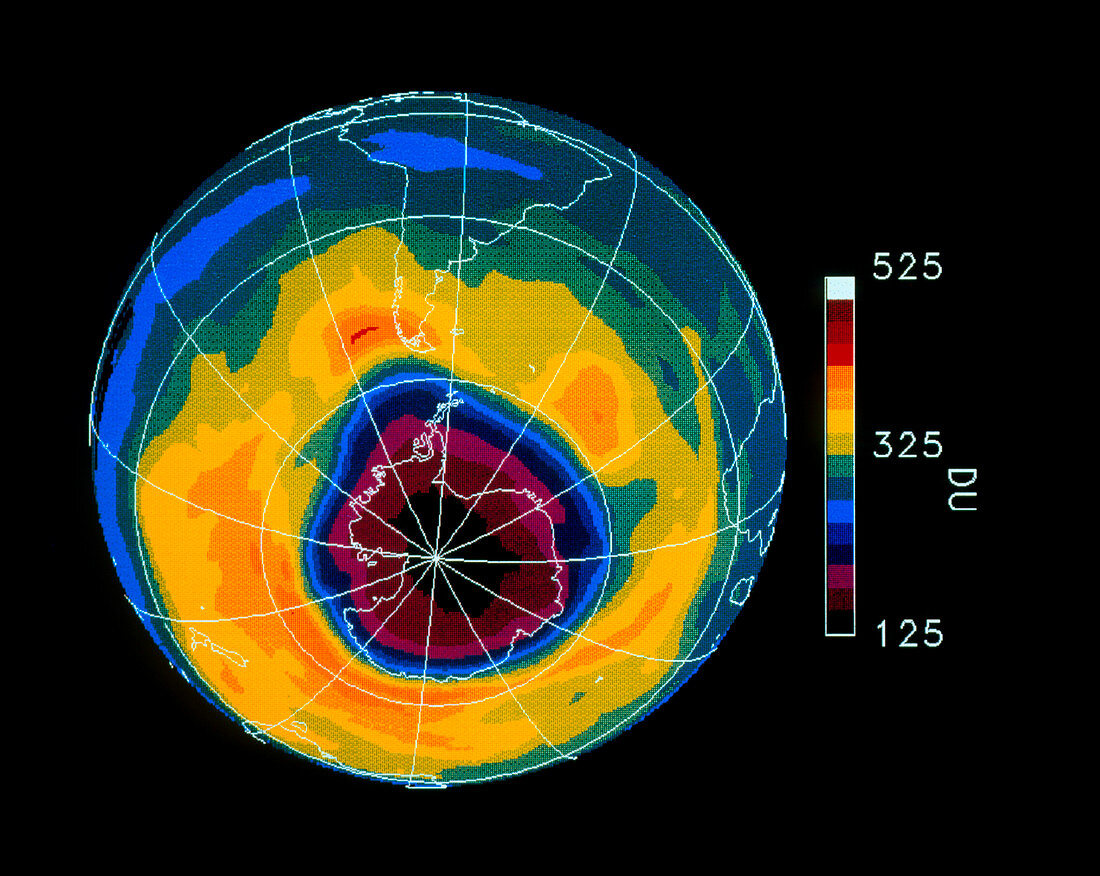
| Satellite map showing a severe depletion or "hole" in the ozone layer over Antarctica on October 3rd,1990. The hole is believed to be due to pollution of the atmosphere by chlorofluorocarbons used in aerosols & refrigerants. First observed in 1980,the most severe depletion was recorded in October 1987. This image represents the maximum depletion during the Antarctic spring of 1990. It appears here as the pink,purple & black areas covering Antarctica (outlined in white) & beyond. The scale of colours represents Dobson units,a measure of atmospheric ozone. The map was made by the Total Ozone Mapping Spectrometer (TOMS) on the American Nimbus-7 weather satellite | |
| Lizenzart: | Lizenzpflichtig |
| Credit: | Science Photo Library / NASA |
| Bildgröße: | 3543 px × 2821 px |
| Modell-Rechte: | nicht erforderlich |
| Eigentums-Rechte: | nicht erforderlich |
| Restrictions: | - |
Preise für dieses Bild ab 15 €
Universitäten & Organisationen
(Informationsmaterial Digital, Informationsmaterial Print, Lehrmaterial Digital etc.)
ab 15 €
Redaktionell
(Bücher, Bücher: Sach- und Fachliteratur, Digitale Medien (redaktionell) etc.)
ab 30 €
Werbung
(Anzeigen, Aussenwerbung, Digitale Medien, Fernsehwerbung, Karten, Werbemittel, Zeitschriften etc.)
ab 55 €
Handelsprodukte
(bedruckte Textilie, Kalender, Postkarte, Grußkarte, Verpackung etc.)
ab 75 €
Pauschalpreise
Rechtepakete für die unbeschränkte Bildnutzung in Print oder Online
ab 495 €