Satellite map of global ozone
Bildnummer 11736295
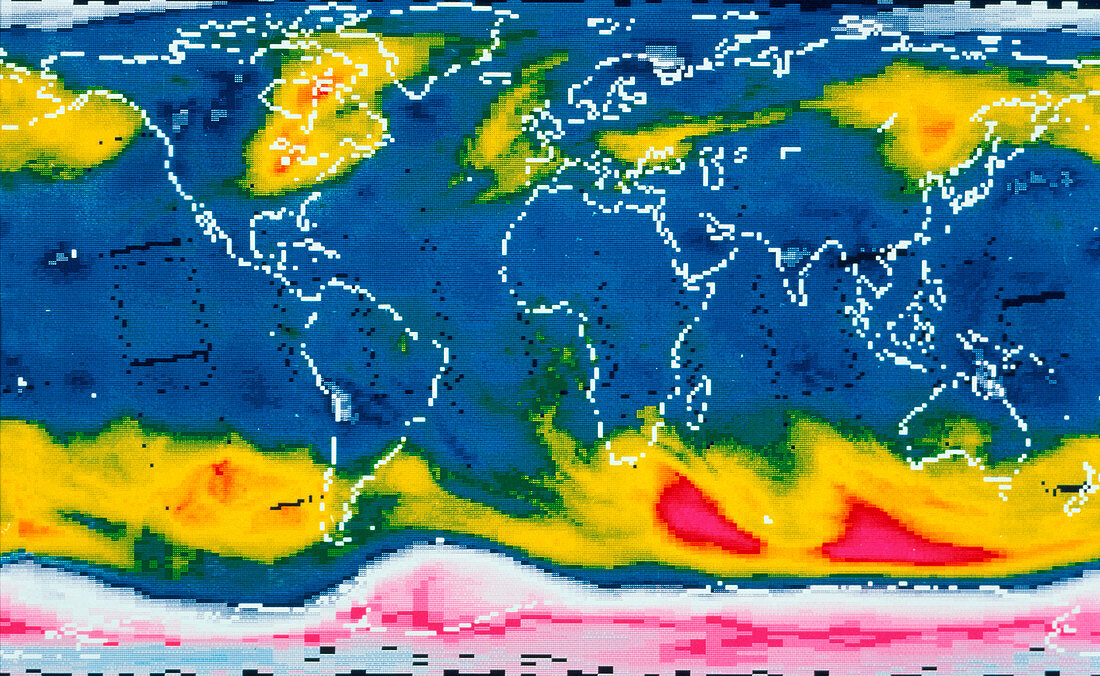
| Satellite map of global ozone on October 2,1987,showing the severe depletion or "hole" in the ozone layer over Antarctica. The hole is probably due to pollution of the atmosphere by chlorofluor- ocarbons (CFCs). First seen in 1980,the "hole" has grown in severity. It reaches a maximum in October,the Antarctic spring. It is visible here as the pink & white area covering the south polar latitudes (bottom). The colours represent Dobson units,a measure of atmospheric ozone; blue,yellow & red represent increasing concentration of ozone. The map was made from data obtained by the Nimbus-7 weather satellite | |
| Lizenzart: | Lizenzpflichtig |
| Credit: | Science Photo Library / LABORATORY FOR ATMOSPHERES, NASA GODDARD SPACE FLIGHT CENTER |
| Bildgröße: | 4627 px × 2845 px |
| Modell-Rechte: | nicht erforderlich |
| Eigentums-Rechte: | nicht erforderlich |
| Restrictions: | - |
Preise für dieses Bild ab 15 €
Universitäten & Organisationen
(Informationsmaterial Digital, Informationsmaterial Print, Lehrmaterial Digital etc.)
ab 15 €
Redaktionell
(Bücher, Bücher: Sach- und Fachliteratur, Digitale Medien (redaktionell) etc.)
ab 30 €
Werbung
(Anzeigen, Aussenwerbung, Digitale Medien, Fernsehwerbung, Karten, Werbemittel, Zeitschriften etc.)
ab 55 €
Handelsprodukte
(bedruckte Textilie, Kalender, Postkarte, Grußkarte, Verpackung etc.)
ab 75 €
Pauschalpreise
Rechtepakete für die unbeschränkte Bildnutzung in Print oder Online
ab 495 €