Africa at night,1993-2003 changes
Bildnummer 11736009
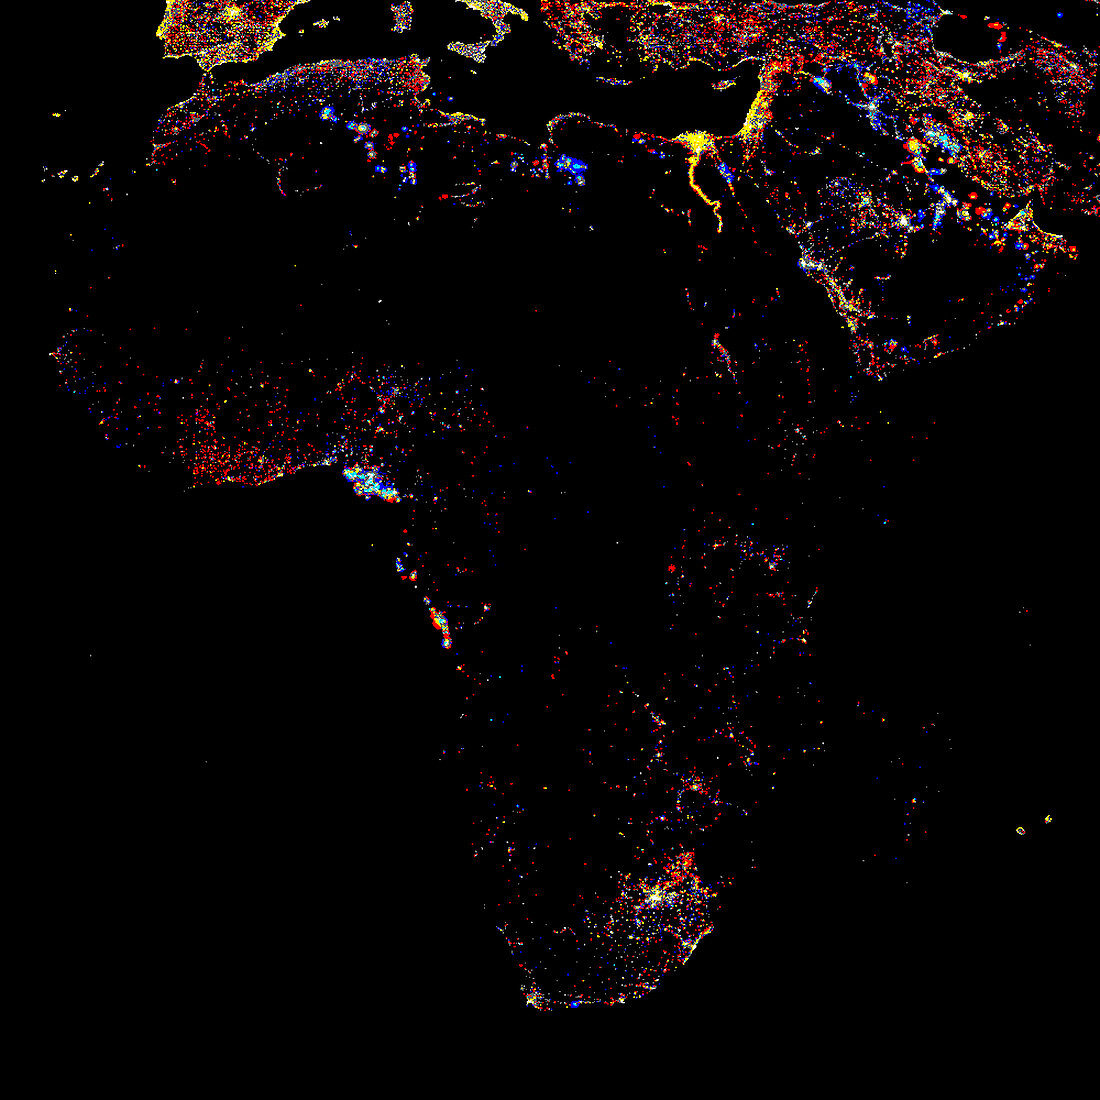
| Africa at night,showing the change in illumination from 1993-2003. This data is based on satellite observations. Lights are colour-coded. Red lights appeared during that period. Orange and yellow areas are regions of high and low intensity lighting respectively that increased in brightness over the ten years. Grey areas are unchanged. Pale blue and dark blue areas are of low and high intensity lighting that decreased in brightness. Very dark blue areas were present in 1993 and had disappeared by 2003. The abundance of red and yellow on the map shows that nights are getting brighter in many areas,but that the majority of the continent is still very dark | |
| Lizenzart: | Lizenzpflichtig |
| Credit: | Science Photo Library / NOAA |
| Bildgröße: | 3000 px × 3000 px |
| Modell-Rechte: | nicht erforderlich |
| Eigentums-Rechte: | nicht erforderlich |
| Restrictions: |
|
Preise für dieses Bild ab 15 €
Universitäten & Organisationen
(Informationsmaterial Digital, Informationsmaterial Print, Lehrmaterial Digital etc.)
ab 15 €
Redaktionell
(Bücher, Bücher: Sach- und Fachliteratur, Digitale Medien (redaktionell) etc.)
ab 30 €
Werbung
(Anzeigen, Aussenwerbung, Digitale Medien, Fernsehwerbung, Karten, Werbemittel, Zeitschriften etc.)
ab 55 €
Handelsprodukte
(bedruckte Textilie, Kalender, Postkarte, Grußkarte, Verpackung etc.)
ab 75 €
Pauschalpreise
Rechtepakete für die unbeschränkte Bildnutzung in Print oder Online
ab 495 €
Keywords
- 21. Jahrhundert,
- Afrika,
- Ägypten,
- Alt,
- Dritte Welt,
- Entwicklungsländer,
- Erdbeobachtung,
- Erdkunde,
- Israel,
- Kontinent,
- ländlich,
- Licht,
- Lichter,
- mehrere,
- Nacht,
- Nachtzeit,
- Neu,
- Satellitenbild,
- schlecht,
- Stadt,
- Städte,
- Südafrika,
- Unterschied,
- Unterschiede,
- Urbanisierung,
- Veränderung,
- viele,
- Weltall,
- Wissenschaften,
- Zeit