Linguistic and plant diversity
Bildnummer 11723609
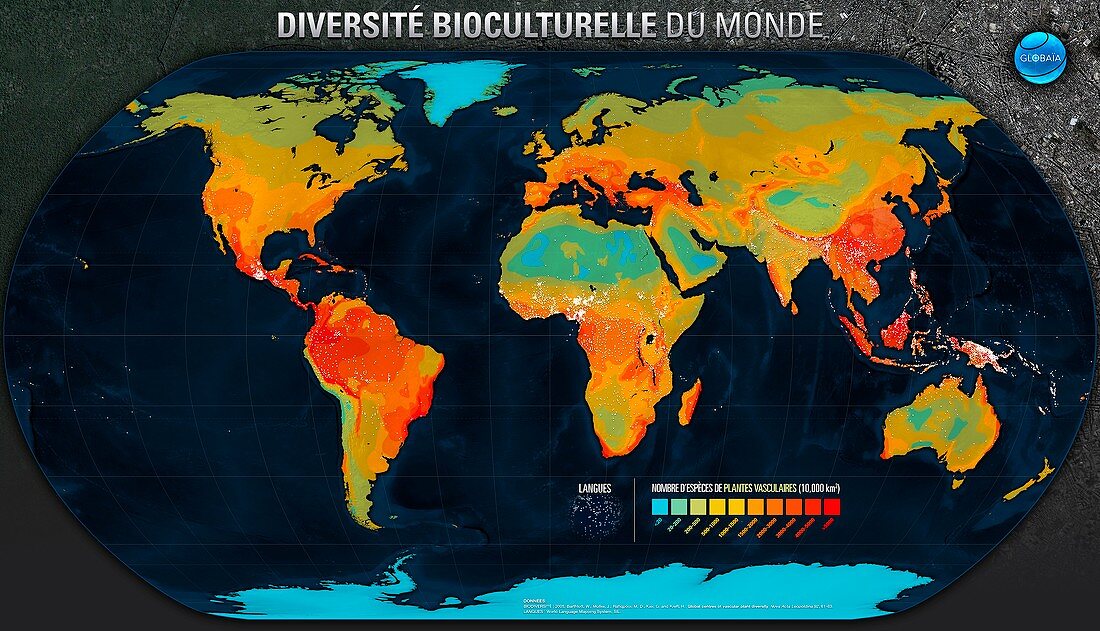
| Map showing the distribution of the world's languages (white dots) and the global diversity of vascular plants. Plant biodiversity is colour-coded. Areas of low diversity are blue,moving through green,yellow and orange to red areas of high diversity. The language map is based on data from 'Ethnologue: Languages of the World',published by SIL International. The 2015 edition contained statistics for 7472 languages and dialects. The plant data is from 'Global Centres of Vascular Plant Diversity' by Barthlott et al (2005) | |
| Lizenzart: | Lizenzpflichtig |
| Credit: | Science Photo Library / Pharand-Deschenes, Felix |
| Bildgröße: | 5526 px × 3170 px |
| Modell-Rechte: | nicht erforderlich |
| Eigentums-Rechte: | nicht erforderlich |
| Restrictions: | - |
Preise für dieses Bild ab 15 €
Universitäten & Organisationen
(Informationsmaterial Digital, Informationsmaterial Print, Lehrmaterial Digital etc.)
ab 15 €
Redaktionell
(Bücher, Bücher: Sach- und Fachliteratur, Digitale Medien (redaktionell) etc.)
ab 30 €
Werbung
(Anzeigen, Aussenwerbung, Digitale Medien, Fernsehwerbung, Karten, Werbemittel, Zeitschriften etc.)
ab 55 €
Handelsprodukte
(bedruckte Textilie, Kalender, Postkarte, Grußkarte, Verpackung etc.)
ab 75 €
Pauschalpreise
Rechtepakete für die unbeschränkte Bildnutzung in Print oder Online
ab 495 €
Keywords
- 21. Jahrhundert,
- Anthropologie,
- anthropologisch,
- Biologie,
- biologisch,
- Botanik,
- botanisch,
- Daten,
- Dichte,
- Distribution,
- Erde,
- Flora,
- geografisch,
- Geographie,
- Geowissenschaften,
- Illustration,
- Karte,
- Kunstwerk,
- Linguistik,
- menschliche Geografie,
- Natur,
- Niemand,
- Planet,
- planetarisch,
- SIL International,
- Sprache,
- Sprachen der Welt,
- Umweltwissenschaften,
- Vielfalt,
- Vielfältig,
- Welt,
- weltweit