Magnetic chart of the Atlantic,1740s
Bildnummer 11703527
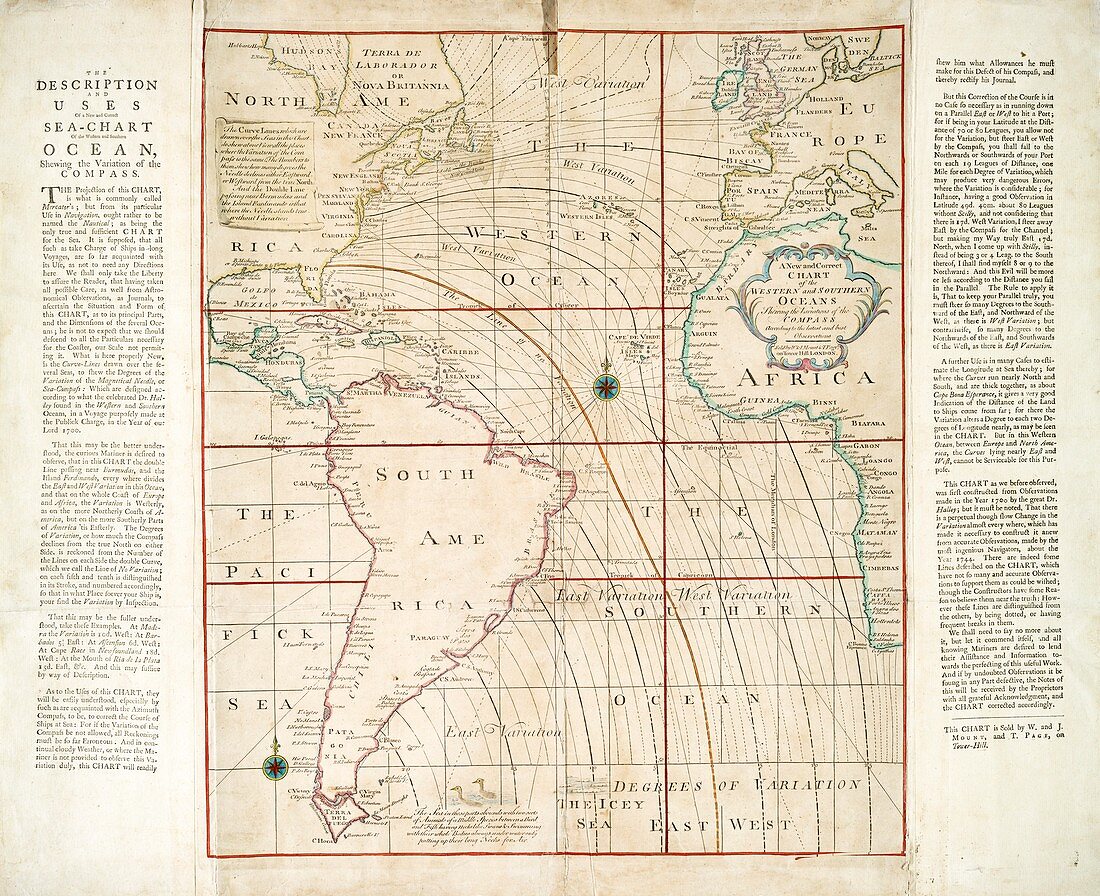
| Magnetic chart of the Atlantic. Chart of the Atlantic Ocean showing variations in compass readings,originally published in 1700 (see E056/0100) by the English astronomer,meteorologist and physicist Edmond Halley (1656-1742) and here updated and reissued after 1744. In 1698 and 1699 Halley,most famous for his work on comets,was given command of a ship by King George III and told to record geographical variations in compass readings (the amount the horizontal alignment of the needle differs from geographical North) as a way for sailors to determine longitude. The lines,known as isogonic lines,show places where the magnetic variation is equal | |
| Lizenzart: | Lizenzpflichtig |
| Credit: | Science Photo Library / NEW YORK PUBLIC LIBRARY / The Lionel Pincus and Princess Firyal Map Division / Stephen A. Schwarzman Building |
| Bildgröße: | 5079 px × 4138 px |
| Modell-Rechte: | nicht erforderlich |
| Eigentums-Rechte: | nicht erforderlich |
| Restrictions: | - |
Preise für dieses Bild ab 15 €
Universitäten & Organisationen
(Informationsmaterial Digital, Informationsmaterial Print, Lehrmaterial Digital etc.)
ab 15 €
Redaktionell
(Bücher, Bücher: Sach- und Fachliteratur, Digitale Medien (redaktionell) etc.)
ab 30 €
Werbung
(Anzeigen, Aussenwerbung, Digitale Medien, Fernsehwerbung, Karten, Werbemittel, Zeitschriften etc.)
ab 55 €
Handelsprodukte
(bedruckte Textilie, Kalender, Postkarte, Grußkarte, Verpackung etc.)
ab 75 €
Pauschalpreise
Rechtepakete für die unbeschränkte Bildnutzung in Print oder Online
ab 495 €
Keywords
- 1700er Jahre,
- 18. Jahrhundert,
- Alt,
- Alter,
- Atlantischer Ozean,
- Diagramm,
- Einfarbig,
- Forschung,
- Gedruckt,
- geografisch,
- Geographie,
- Geschichte,
- historisch,
- Illustration,
- Karte,
- Karten,
- Kartographie,
- Kunstwerk,
- Linien,
- Maritim,
- Meer,
- Meereskunde,
- Meteorologie,
- meteorologisch,
- Navigation,
- Niemand,
- Ozean,
- Schreiben,
- schwarz und weiß,
- Text,
- Variation,
- Wetter