Global air pollution mortality levels
Bildnummer 11696033
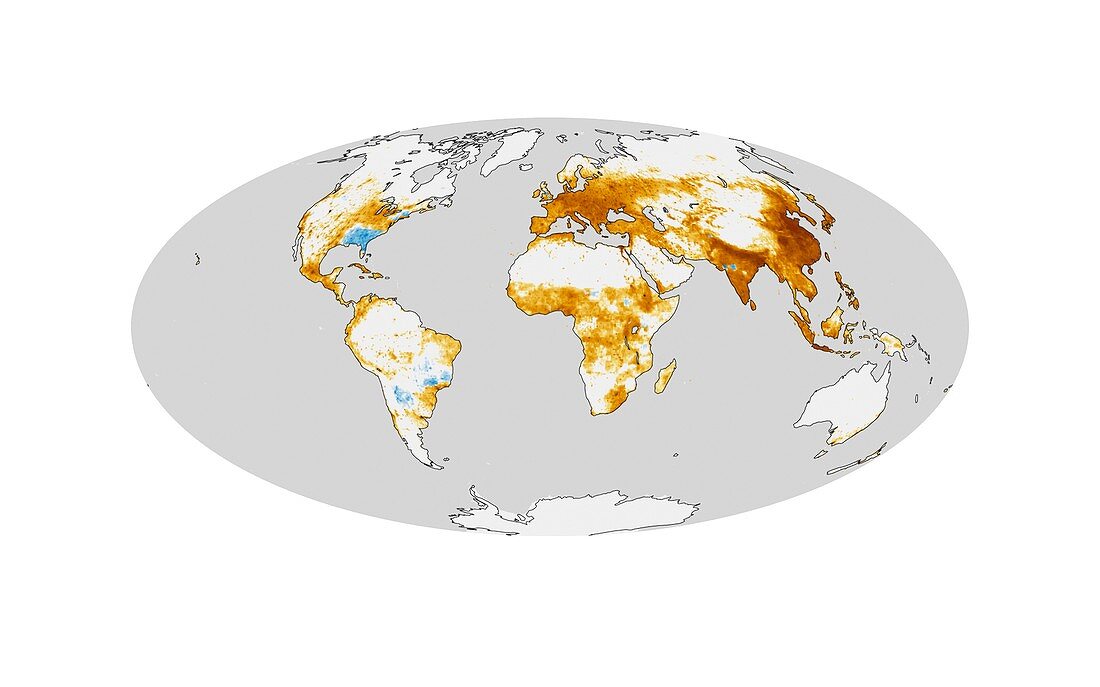
| Global air pollution mortality levels. Computer model showing the estimated global variations in mortality levels due to air pollution. The colour-coding shows the estimated change in the number of premature deaths per year per 1000 square kilometres. The changes range on a logarithmic scale from minus 1000 (blue) to plus 1000 (orange). The model is based on the difference in pollution levels between 1850 and 2000. Fine particulate matter (PM2.5) has had a large impact in eastern China,northern India,and Europe,where urbanisation has added large quantities of PM2.5 to the atmosphere since the start of the Industrial Revolution. Image published in 2013 | |
| Lizenzart: | Lizenzpflichtig |
| Credit: | Science Photo Library / NASA Earth Observatory |
| Bildgröße: | 3743 px × 2339 px |
| Modell-Rechte: | nicht erforderlich |
| Eigentums-Rechte: | nicht erforderlich |
| Restrictions: | - |
Preise für dieses Bild ab 15 €
Universitäten & Organisationen
(Informationsmaterial Digital, Informationsmaterial Print, Lehrmaterial Digital etc.)
ab 15 €
Redaktionell
(Bücher, Bücher: Sach- und Fachliteratur, Digitale Medien (redaktionell) etc.)
ab 30 €
Werbung
(Anzeigen, Aussenwerbung, Digitale Medien, Fernsehwerbung, Karten, Werbemittel, Zeitschriften etc.)
ab 55 €
Handelsprodukte
(bedruckte Textilie, Kalender, Postkarte, Grußkarte, Verpackung etc.)
ab 75 €
Pauschalpreise
Rechtepakete für die unbeschränkte Bildnutzung in Print oder Online
ab 495 €
Keywords
- 1900er Jahre,
- 20. Jahrhundert,
- 2000,
- 2013,
- 21. Jahrhundert,
- ausgeschnitten,
- Ausschnitte,
- China,
- Ebenen,
- Epidemiologie,
- Erdbeobachtung,
- Erde,
- Erdkunde,
- Europa,
- farbcodiert,
- geografisch,
- Geographie,
- Gesundheitswesen,
- Indien,
- Industrie,
- Industriell,
- Karte,
- Medizin,
- medizinisch,
- Niemand,
- Planet,
- planetarisch,
- Projektion,
- tödlich,
- Umwelt,
- Urbanisierung,
- Variation,
- Variationen,
- weißer Hintergrund,
- weltweit