Computer logging of results
Bildnummer 11618461
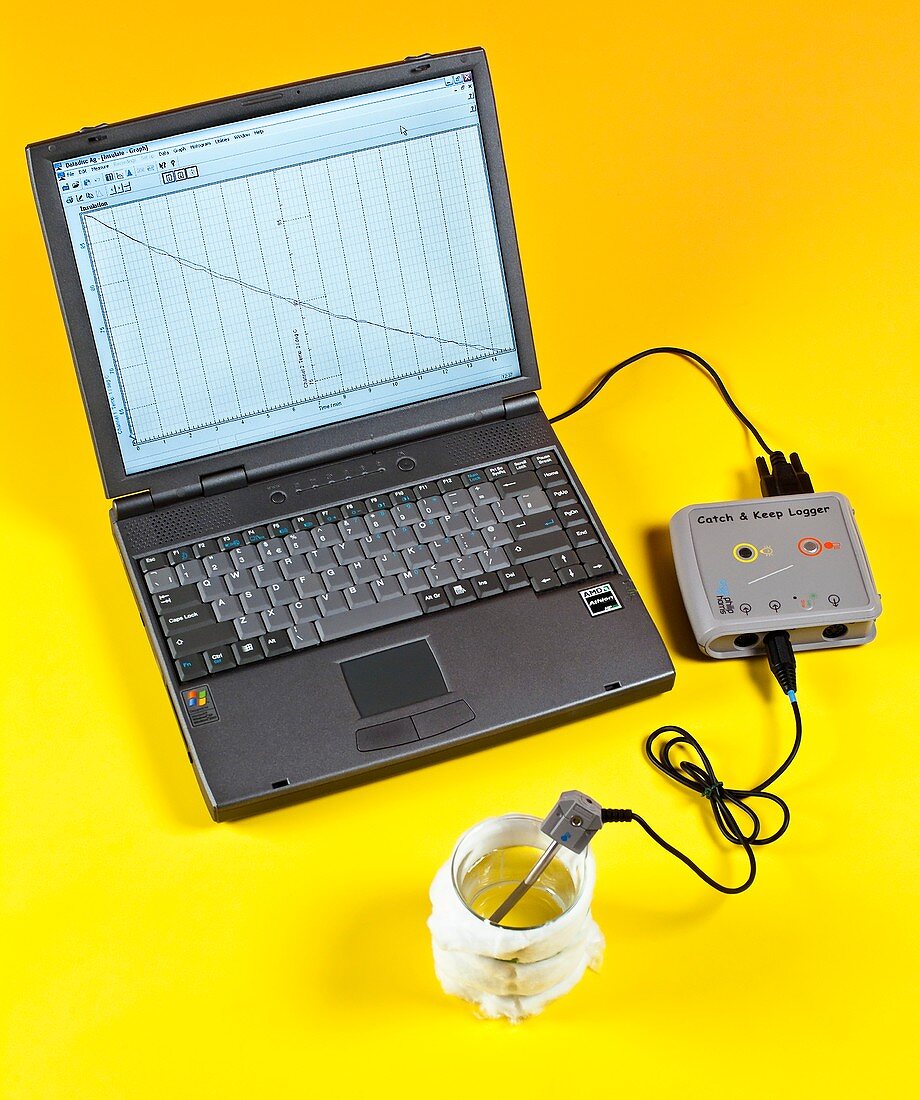
| Computer logging of results. Laptop computer and datalogger (centre right) being used to record the results of an experiment that is tracking the changes in temperature of water in an insulated beaker (lower centre). The laptop screen shows the results plotted on a graph as temperature in degrees Celsius (vertical axis) against time in minutes (horizontal axis). The temperature of the water decreased over a period of 15 minutes from around 90 to around 60 degrees Celsius. The insulation used here is cotton wool surrounding a glass beaker | |
| Lizenzart: | Lizenzpflichtig |
| Credit: | Science Photo Library / Chillmaid, Martyn F. |
| Bildgröße: | 3831 px × 4583 px |
| Modell-Rechte: | nicht erforderlich |
| Eigentums-Rechte: | nicht erforderlich |
| Restrictions: | - |
Preise für dieses Bild ab 15 €
Universitäten & Organisationen
(Informationsmaterial Digital, Informationsmaterial Print, Lehrmaterial Digital etc.)
ab 15 €
Redaktionell
(Bücher, Bücher: Sach- und Fachliteratur, Digitale Medien (redaktionell) etc.)
ab 30 €
Werbung
(Anzeigen, Aussenwerbung, Digitale Medien, Fernsehwerbung, Karten, Werbemittel, Zeitschriften etc.)
ab 55 €
Handelsprodukte
(bedruckte Textilie, Kalender, Postkarte, Grußkarte, Verpackung etc.)
ab 75 €
Pauschalpreise
Rechtepakete für die unbeschränkte Bildnutzung in Print oder Online
ab 495 €