Human genome map
Bildnummer 11575502
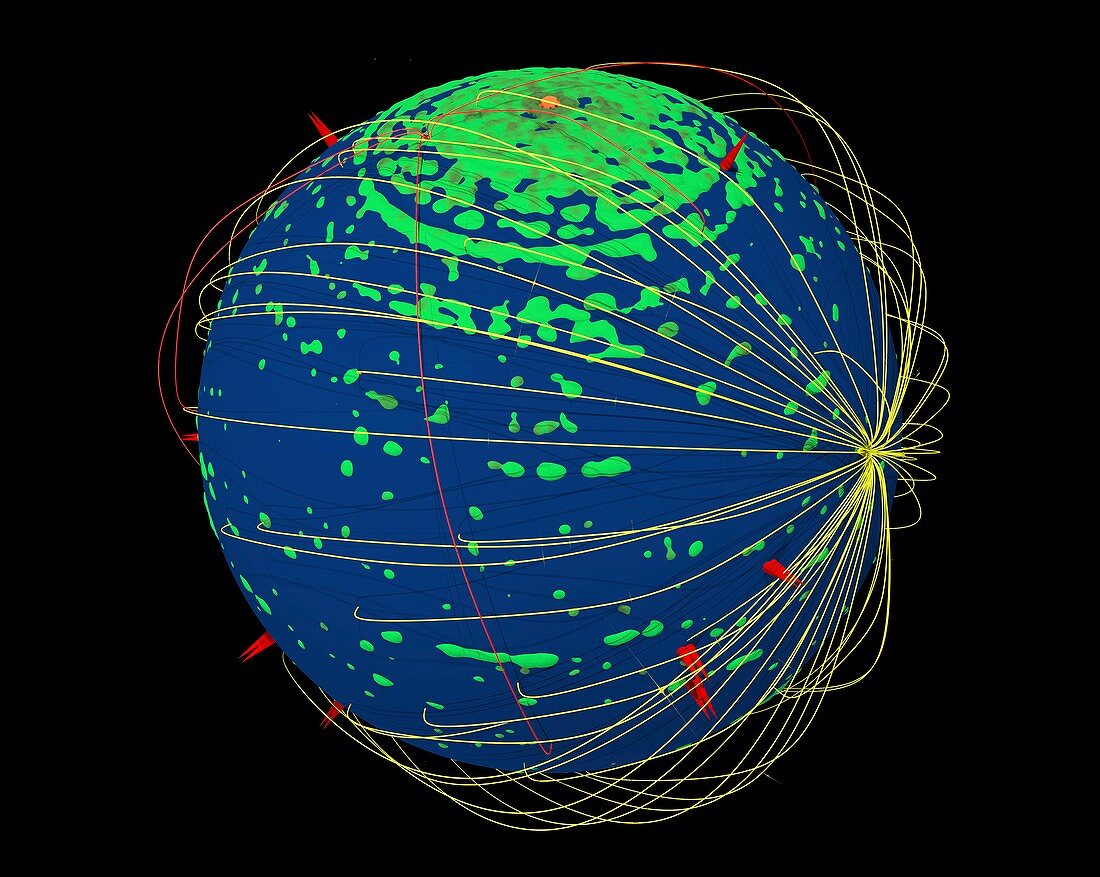
| Human genome map,computer artwork. This map was created by rendering all the DNA strands that make up the human genome into a planet-like sphere. Gene density is represented by green (high density) and blue (low density). Yellow lines represent the regulation of other genes by the genes that control inflammation and tumour formation. This map is one of a series of 'genomic planets' created by German biologist Thomas Fester | |
| Lizenzart: | Lizenzpflichtig |
| Credit: | Science Photo Library / Fester, Thomas |
| Bildgröße: | 5333 px × 4252 px |
| Modell-Rechte: | nicht erforderlich |
| Eigentums-Rechte: | nicht erforderlich |
| Restrictions: | - |
Preise für dieses Bild ab 15 €
Universitäten & Organisationen
(Informationsmaterial Digital, Informationsmaterial Print, Lehrmaterial Digital etc.)
ab 15 €
Redaktionell
(Bücher, Bücher: Sach- und Fachliteratur, Digitale Medien (redaktionell) etc.)
ab 30 €
Werbung
(Anzeigen, Aussenwerbung, Digitale Medien, Fernsehwerbung, Karten, Werbemittel, Zeitschriften etc.)
ab 55 €
Handelsprodukte
(bedruckte Textilie, Kalender, Postkarte, Grußkarte, Verpackung etc.)
ab 75 €
Pauschalpreise
Rechtepakete für die unbeschränkte Bildnutzung in Print oder Online
ab 495 €
Keywords
- Abstrakt,
- Ball,
- Biologie,
- biologisch,
- DNA,
- Fauna,
- Gene,
- Genetik,
- genetisch,
- Genom,
- Genomik,
- genomische Karte,
- Genregulation,
- Globus,
- Illustration,
- Karte,
- Kugel,
- kugelförmig,
- Kunstwerk,
- Mensch,
- Menschen,
- Molekül,
- Natur,
- Person,
- Planet,
- rund,
- Zoologie,
- zoologisch