World population density in 2000
Bildnummer 11575452
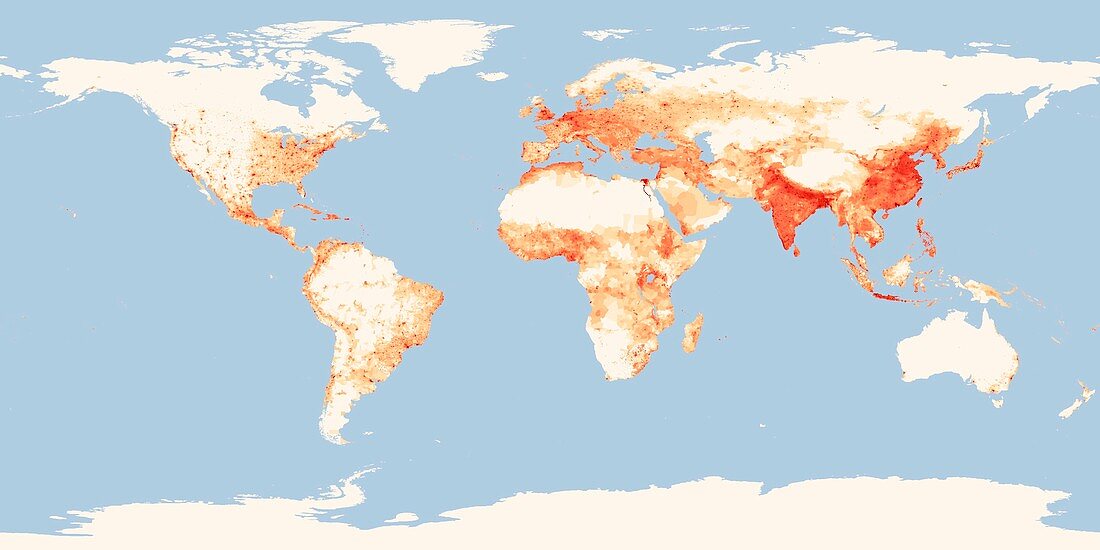
| World population density in 2000. Colour-coded map showing the variation in population density around the world in the year 2000. The scale is from 1 (white) to 10,000 or more (red) people per square kilometre. The red dots show the locations of cities,with rural areas being less densely populated. The most densely populated areas are in Japan,China,Indonesia,India and parts of Europe. This map is based on data from the Gridded Population of the World dataset,Version 3 (GPWv3),produced by the Socioeconomic Data and Applications Center (SEDAC),Columbia University,USA | |
| Lizenzart: | Lizenzpflichtig |
| Credit: | Science Photo Library / SEDAC, COLUMBIA UNIVERSITY / ROBERT SIMMON, EARTH OBSERVATORY / NASA |
| Bildgröße: | 5929 px × 2965 px |
| Modell-Rechte: | nicht erforderlich |
| Eigentums-Rechte: | nicht erforderlich |
| Restrictions: | - |
Preise für dieses Bild ab 15 €
Universitäten & Organisationen
(Informationsmaterial Digital, Informationsmaterial Print, Lehrmaterial Digital etc.)
ab 15 €
Redaktionell
(Bücher, Bücher: Sach- und Fachliteratur, Digitale Medien (redaktionell) etc.)
ab 30 €
Werbung
(Anzeigen, Aussenwerbung, Digitale Medien, Fernsehwerbung, Karten, Werbemittel, Zeitschriften etc.)
ab 55 €
Handelsprodukte
(bedruckte Textilie, Kalender, Postkarte, Grußkarte, Verpackung etc.)
ab 75 €
Pauschalpreise
Rechtepakete für die unbeschränkte Bildnutzung in Print oder Online
ab 495 €