18th century chemical affinity table
Bildnummer 11554264
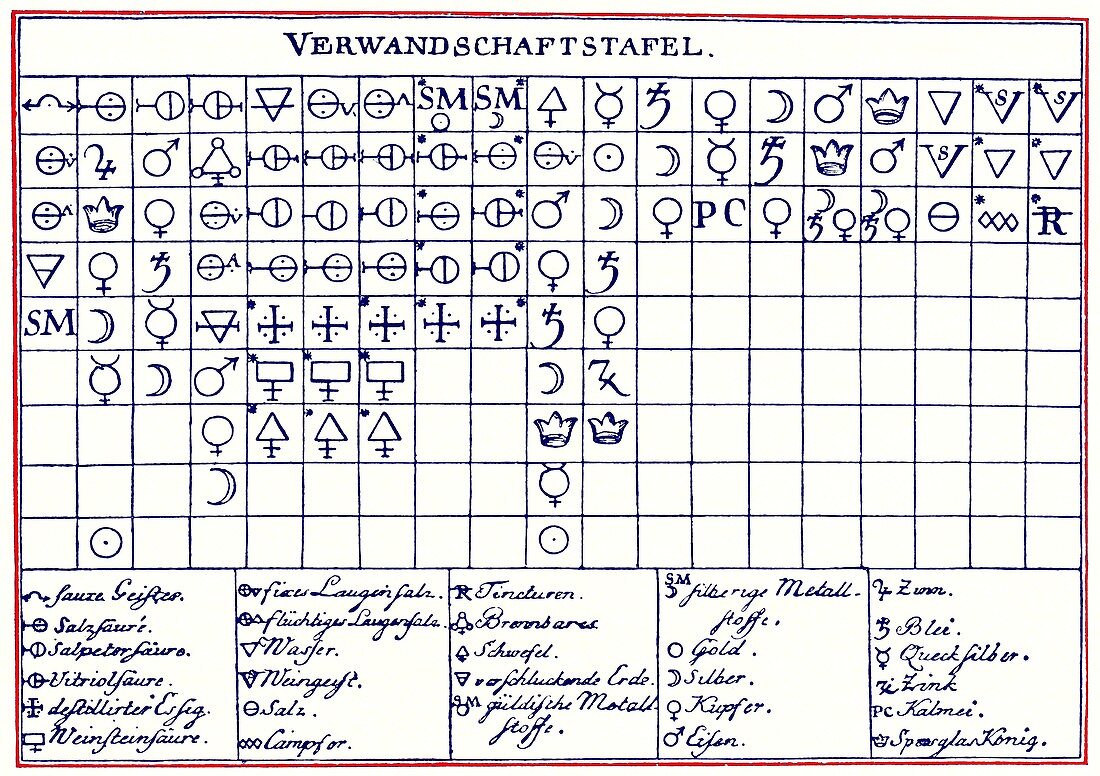
| 18th century chemical affinity table. Historical chart describing the tendency of different substances to combine with each other. This was the first ever affinity table,published in 1718 by the French chemist Etienne Francois Geoffroy (1672-1731). Each substance is represented by a different symbol. At the top of each column is a substance (header) with which all those below can combine. Each row below the header is ranked by degrees of affinity. A key to the symbols used can be seen at the bottom | |
| Lizenzart: | Lizenzpflichtig |
| Credit: | Science Photo Library / Terry, Sheila |
| Bildgröße: | 5023 px × 3543 px |
| Modell-Rechte: | nicht erforderlich |
| Eigentums-Rechte: | nicht erforderlich |
| Restrictions: | - |
Preise für dieses Bild ab 15 €
Universitäten & Organisationen
(Informationsmaterial Digital, Informationsmaterial Print, Lehrmaterial Digital etc.)
ab 15 €
Redaktionell
(Bücher, Bücher: Sach- und Fachliteratur, Digitale Medien (redaktionell) etc.)
ab 30 €
Werbung
(Anzeigen, Aussenwerbung, Digitale Medien, Fernsehwerbung, Karten, Werbemittel, Zeitschriften etc.)
ab 55 €
Handelsprodukte
(bedruckte Textilie, Kalender, Postkarte, Grußkarte, Verpackung etc.)
ab 75 €
Pauschalpreise
Rechtepakete für die unbeschränkte Bildnutzung in Print oder Online
ab 495 €