Three representations of a conical distribution
Bildnummer 11523325
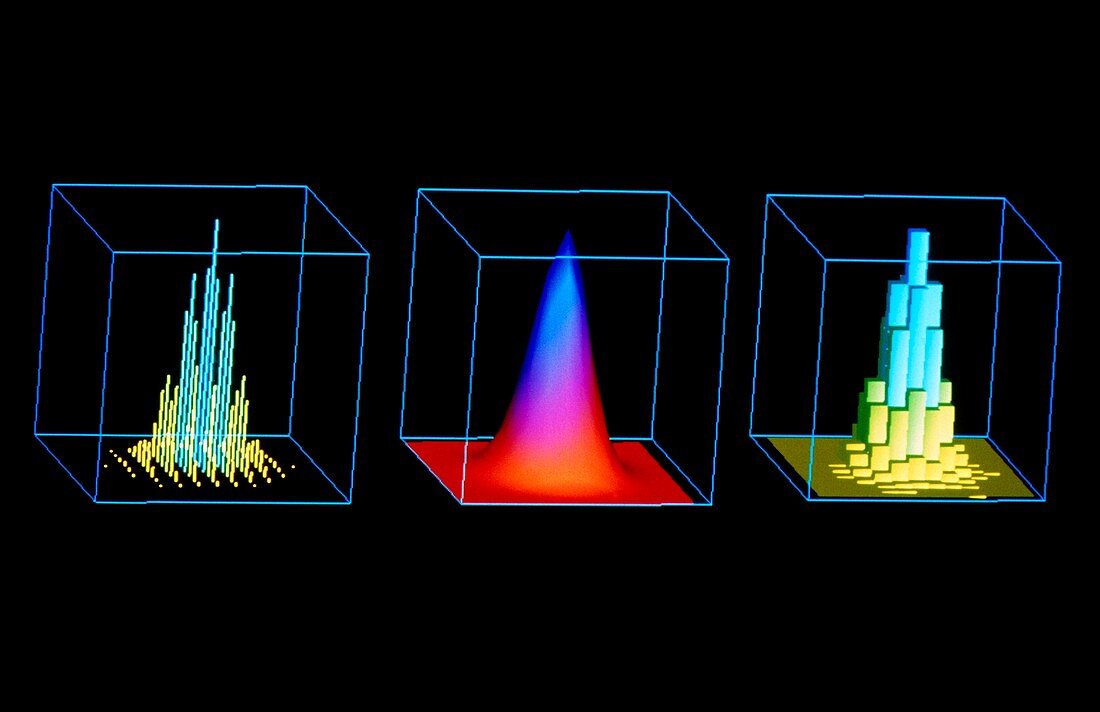
| Visualisation in mathematics: conical distribution in graphical form. Computer graphics image of three ways in which a 3D conical function may be shown graphically. At left is a simple altitude plot,where points on the surface of the cone are plotted and joined to the base (x,z surface) by vertical lines. At right the lines are replaced by histogram blocks. At centre,the points have been interpolated to produce a smooth surface | |
| Lizenzart: | Lizenzpflichtig |
| Credit: | Science Photo Library / Cern |
| Bildgröße: | 5204 px × 3367 px |
| Modell-Rechte: | nicht erforderlich |
| Eigentums-Rechte: | nicht erforderlich |
| Restrictions: |
|
Preise für dieses Bild ab 15 €
Universitäten & Organisationen
(Informationsmaterial Digital, Informationsmaterial Print, Lehrmaterial Digital etc.)
ab 15 €
Redaktionell
(Bücher, Bücher: Sach- und Fachliteratur, Digitale Medien (redaktionell) etc.)
ab 30 €
Werbung
(Anzeigen, Aussenwerbung, Digitale Medien, Fernsehwerbung, Karten, Werbemittel, Zeitschriften etc.)
ab 55 €
Handelsprodukte
(bedruckte Textilie, Kalender, Postkarte, Grußkarte, Verpackung etc.)
ab 75 €
Pauschalpreise
Rechtepakete für die unbeschränkte Bildnutzung in Print oder Online
ab 495 €