Arctic trade routes and projected ice coverage, map
Bildnummer 13743937
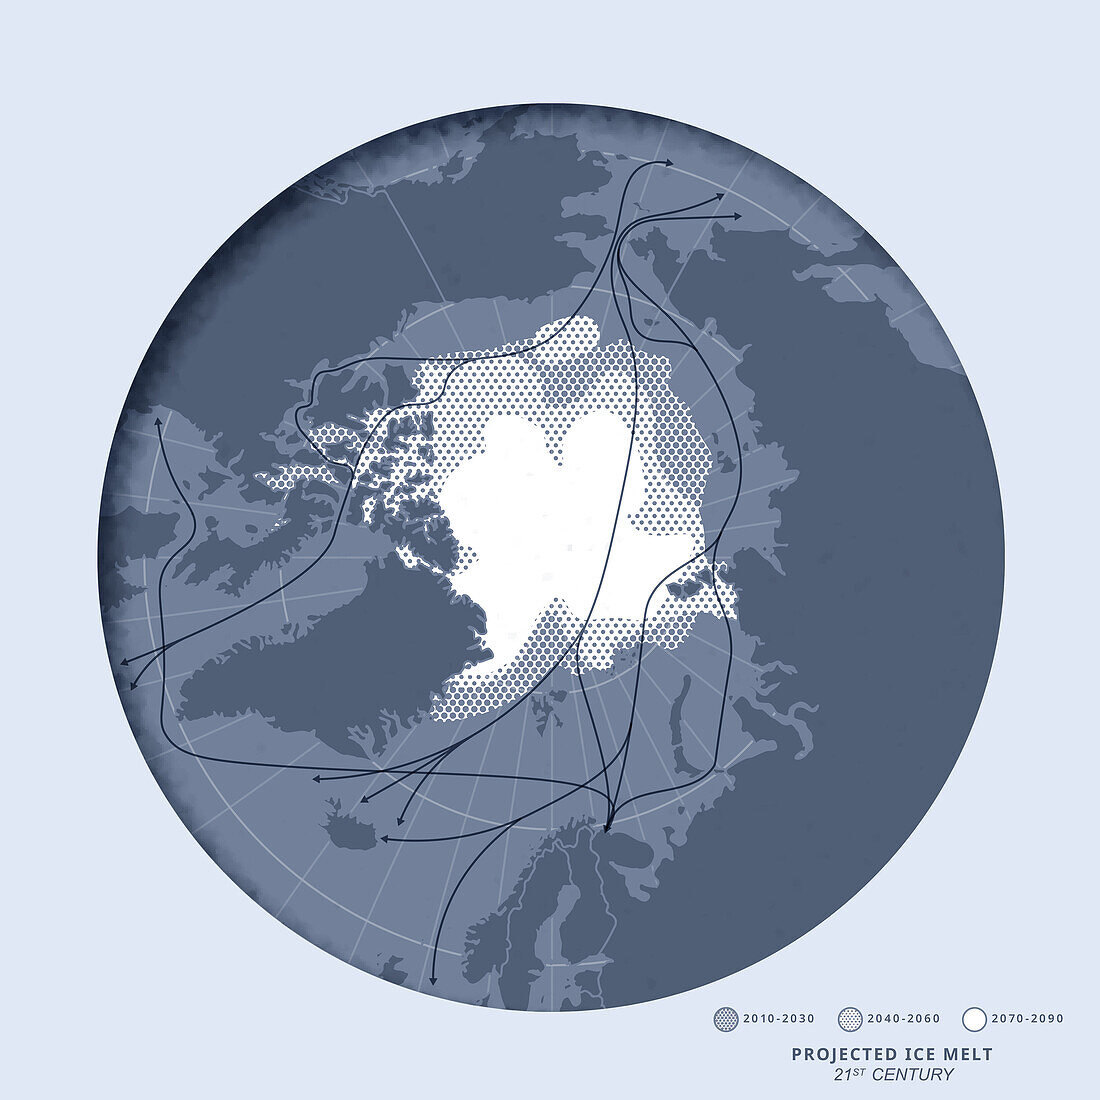
| Map showing Arctic trade routes and projected changes in Arctic pack ice. The dark arrows indicate current sea routes to the Arctic. The dark shaded region shows average sea ice coverage in the years 2010-2030, the mid-shaded region projected ice cover 2040-2060 and the solid white area is projected ice cover 2070-2090. By 2090 the amount of ice is projected to be half of today's coverage. Shrinking ice cover and longer ice-free periods due to global warming will allow easier access for transport and shipping. Projection data by Arctic Climate Impact Assessment (ACIA). | |
| Lizenzart: | Lizenzfrei |
| Credit: | Science Photo Library / VISUAL CAPITALIST |
| Modell-Rechte: | nicht erforderlich |
| Eigentums-Rechte: | nicht erforderlich |
| Restrictions: | - |
Preise für dieses Bild ab 29 €
Für digitale Nutzung (72 dpi)
ab 29 €
Für Druckauflösung (300 dpi)
ab 300 €