CO2 emissions per-capita, illustration
Bildnummer 13743931
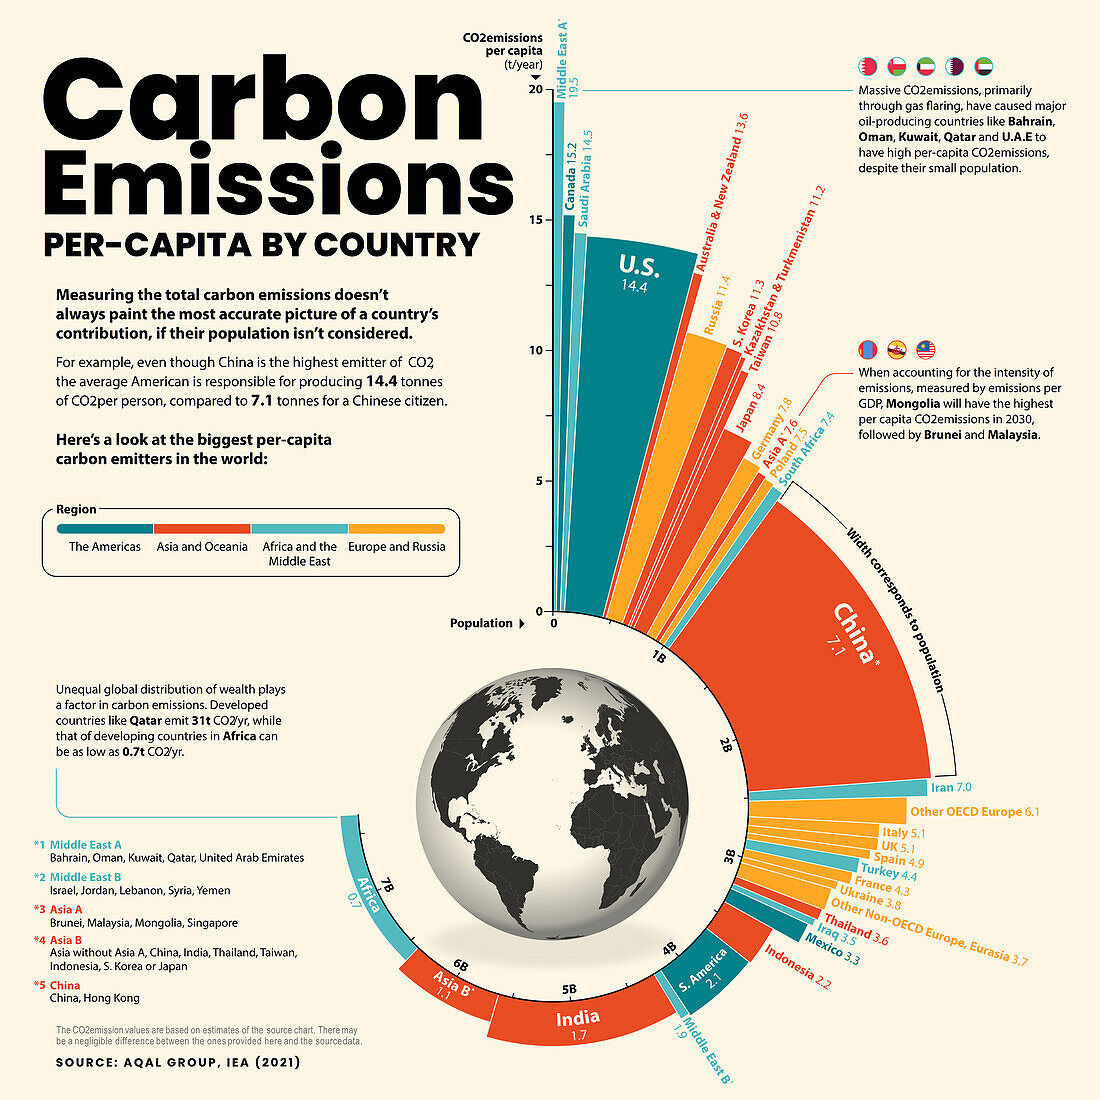
| Infographic illustration depicting carbon emissions per-capita by country. Width corresponds to population, height corresponds with CO2 emissions per capita. China is the most populous nation yet the amount of carbon emissions per person (7.1 tonnes) is lower than the USA (14.4 tonnes). The massive emissions mainly through gas flaring in oil-producing countries like Bahrain, Oman, Kuwait and UAE (categorised under Middle East A) results in their very high per-capita CO2 emissions despite their small populations. | |
| Lizenzart: | Lizenzfrei |
| Credit: | Science Photo Library / VISUAL CAPITALIST |
| Modell-Rechte: | nicht erforderlich |
| Eigentums-Rechte: | nicht erforderlich |
| Restrictions: | - |
Preise für dieses Bild ab 29 €
Für digitale Nutzung (72 dpi)
ab 29 €
Für Druckauflösung (300 dpi)
ab 300 €