Increasing global temperature and CO2, illustration
Bildnummer 13736753
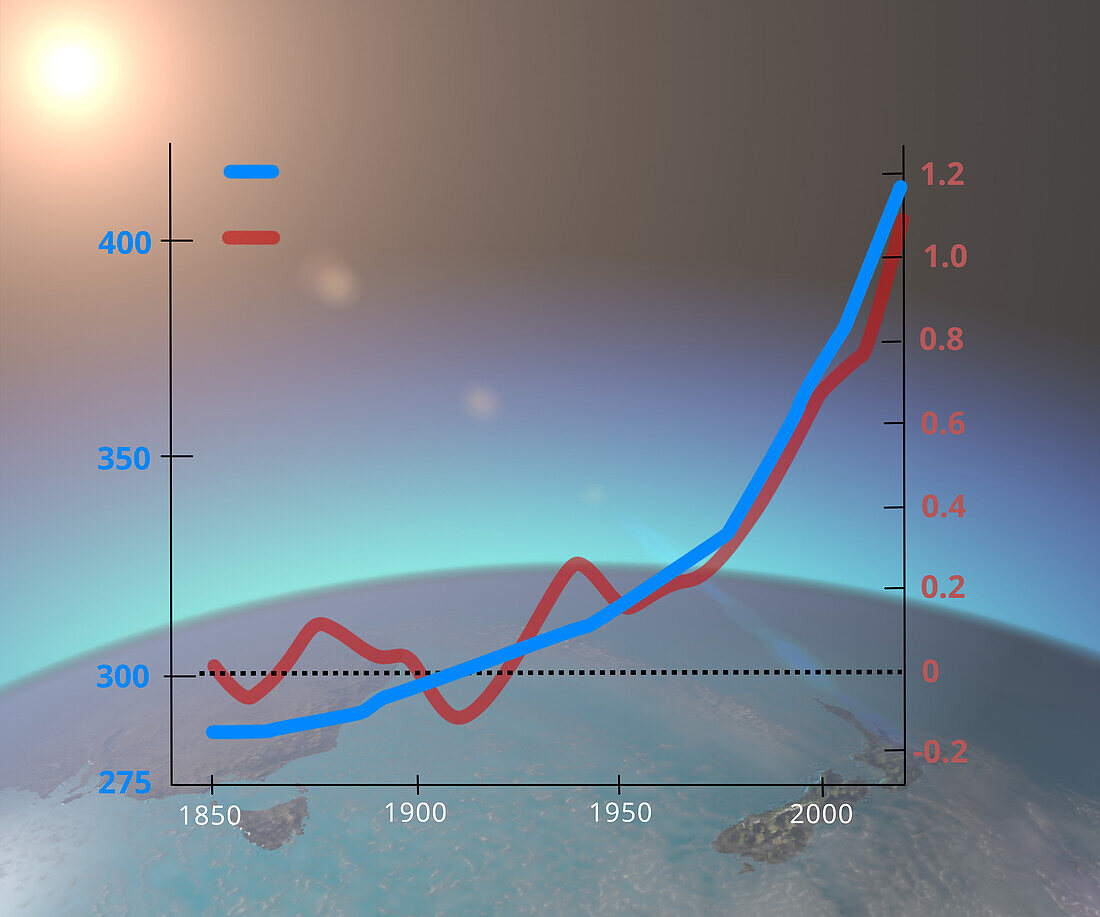
| Graph showing atmospheric carbon dioxide (CO2) levels in parts per million (ppm, blue line) and the increase in average global annual temperature compared to 1859 in degrees Celsius (C, red line) from 1850 to around 2020. Since the Industrial Revolution levels of carbon dioxide, a greenhouse gas, have risen due to the combustion of fossil fuels and deforestation. This has lead to an increase in average global temperatures. For a labelled version of this image see C057/3742. | |
| Lizenzart: | Lizenzpflichtig |
| Credit: | Science Photo Library / Schneider, Karsten |
| Bildgröße: | 3262 px × 2718 px |
| Modell-Rechte: | nicht erforderlich |
| Eigentums-Rechte: | nicht erforderlich |
| Restrictions: | - |
Preise für dieses Bild ab 15 €
Universitäten & Organisationen
(Informationsmaterial Digital, Informationsmaterial Print, Lehrmaterial Digital etc.)
ab 15 €
Redaktionell
(Bücher, Bücher: Sach- und Fachliteratur, Digitale Medien (redaktionell) etc.)
ab 30 €
Werbung
(Anzeigen, Aussenwerbung, Digitale Medien, Fernsehwerbung, Karten, Werbemittel, Zeitschriften etc.)
ab 55 €
Handelsprodukte
(bedruckte Textilie, Kalender, Postkarte, Grußkarte, Verpackung etc.)
ab 75 €
Pauschalpreise
Rechtepakete für die unbeschränkte Bildnutzung in Print oder Online
ab 495 €
Keywords
- 1800er Jahre,
- 19. Jahrhundert,
- 1900er Jahre,
- 20. Jahrhundert,
- 2000er Jahre,
- 21. Jahrhundert,
- alljährlich,
- Atmosphäre,
- atmosphärisch,
- Diagramm,
- Durschnitt,
- Erdkunde,
- Gas,
- geografisch,
- Geographie,
- Globale Erwärmung,
- Grafik,
- Illustration,
- Klimatologie,
- klimatologisch,
- Klimawandel,
- Kohlendioxid,
- Kunstwerk,
- Naturwissenschaft in der Schule,
- Niemand,
- Steigend,
- Temperatur,
- Treibhausgas,
- Umwelt,
- Umweltwissenschaften,
- weltweit,
- Wissenschaftspädagogik