Map showing changes in the Earth's surface mass
Bildnummer 13435940
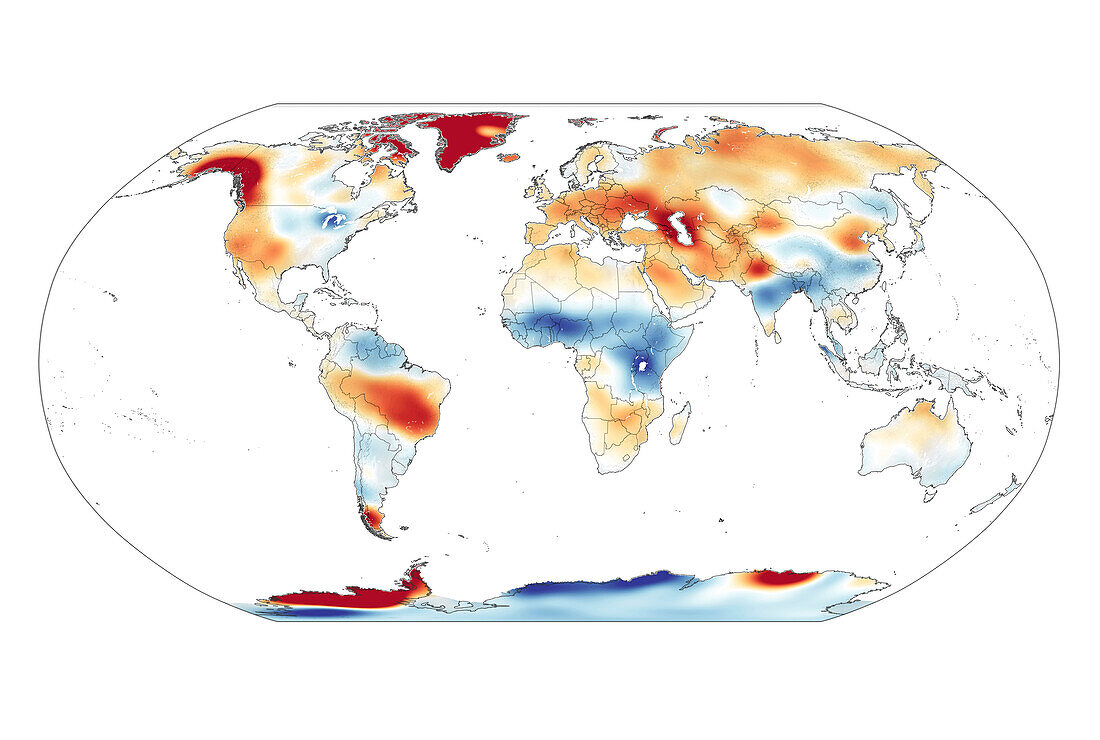
| Map looking at locations on the planet with changes in surface mass from August 2020 compared to the average of all months between 2004 and 2009. The red areas and orange areas show places that have had a decline in the Earth's mass. This is mostly due to changes in water. Blue areas show places where the Earth's mass has increased. The greatest declines in the Earth's mass are seen in ice-rich areas such as Greenland, Alaska and West Antarctica. Data obtained using the Gravity Recovery and Climate Experiment Follow-On (GRACE-FO) satellite. | |
| Lizenzart: | Lizenzpflichtig |
| Credit: | Science Photo Library / NASA |
| Bildgröße: | 3650 px × 2454 px |
| Modell-Rechte: | nicht erforderlich |
| Eigentums-Rechte: | nicht erforderlich |
| Restrictions: | - |
Preise für dieses Bild ab 15 €
Universitäten & Organisationen
(Informationsmaterial Digital, Informationsmaterial Print, Lehrmaterial Digital etc.)
ab 15 €
Redaktionell
(Bücher, Bücher: Sach- und Fachliteratur, Digitale Medien (redaktionell) etc.)
ab 30 €
Werbung
(Anzeigen, Aussenwerbung, Digitale Medien, Fernsehwerbung, Karten, Werbemittel, Zeitschriften etc.)
ab 55 €
Handelsprodukte
(bedruckte Textilie, Kalender, Postkarte, Grußkarte, Verpackung etc.)
ab 75 €
Pauschalpreise
Rechtepakete für die unbeschränkte Bildnutzung in Print oder Online
ab 495 €
Keywords
- 1,
- Eis,
- Erde,
- Globale Erwärmung,
- Karte,
- Klimawandel,
- Niemand,
- Planet,
- Umwelt,
- Wasser