Freshwater global changes, 2002 to 2017
Bildnummer 12949151
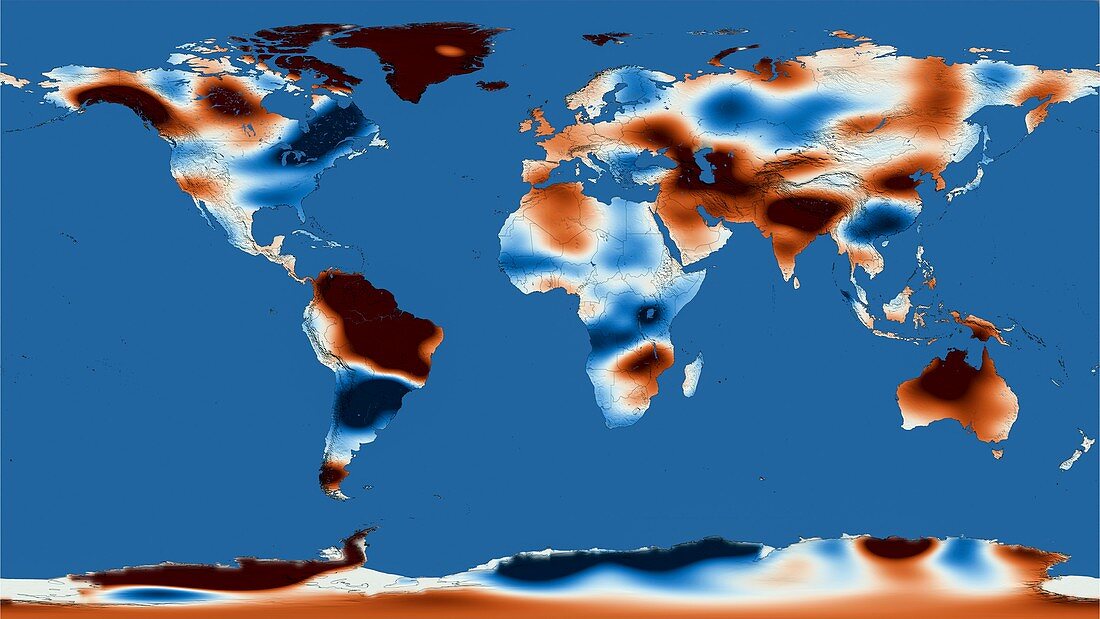
| Freshwater global changes, 2002 to 2017. Global map of changes in freshwater around the world as mapped by observing variations in the Earth's gravitational field. Orange areas are where freshwater has decreased, and areas in blue are where freshwater levels have increased. Climate change has driven freshwater loss from the ice sheets at the poles, which has implications for sea level rise. Other areas saw groundwater depletions because of humans using water for irrigating crops or increases due to higher amounts of rainfall because of natural variability. This data shows the averaged results from 2002 to 2017. The data was acquired by the GRACE (Gravity Recovery and Climate Experiment) satellites operated by NASA and the DLR (Germany) that are in polar orbit around the Earth. Anomalies in the gravitational field, when compared to previous readings, can be used to monitor changes in water levels. | |
| Lizenzart: | Lizenzpflichtig |
| Credit: | Science Photo Library / NASA's Scientific Visualization Studio / NASA |
| Bildgröße: | 6133 px × 3450 px |
| Modell-Rechte: | nicht erforderlich |
| Eigentums-Rechte: | nicht erforderlich |
| Restrictions: | - |
Preise für dieses Bild ab 15 €
Universitäten & Organisationen
(Informationsmaterial Digital, Informationsmaterial Print, Lehrmaterial Digital etc.)
ab 15 €
Redaktionell
(Bücher, Bücher: Sach- und Fachliteratur, Digitale Medien (redaktionell) etc.)
ab 30 €
Werbung
(Anzeigen, Aussenwerbung, Digitale Medien, Fernsehwerbung, Karten, Werbemittel, Zeitschriften etc.)
ab 55 €
Handelsprodukte
(bedruckte Textilie, Kalender, Postkarte, Grußkarte, Verpackung etc.)
ab 75 €
Pauschalpreise
Rechtepakete für die unbeschränkte Bildnutzung in Print oder Online
ab 495 €