Kilauea Eruption, May 2018
Bildnummer 12650802
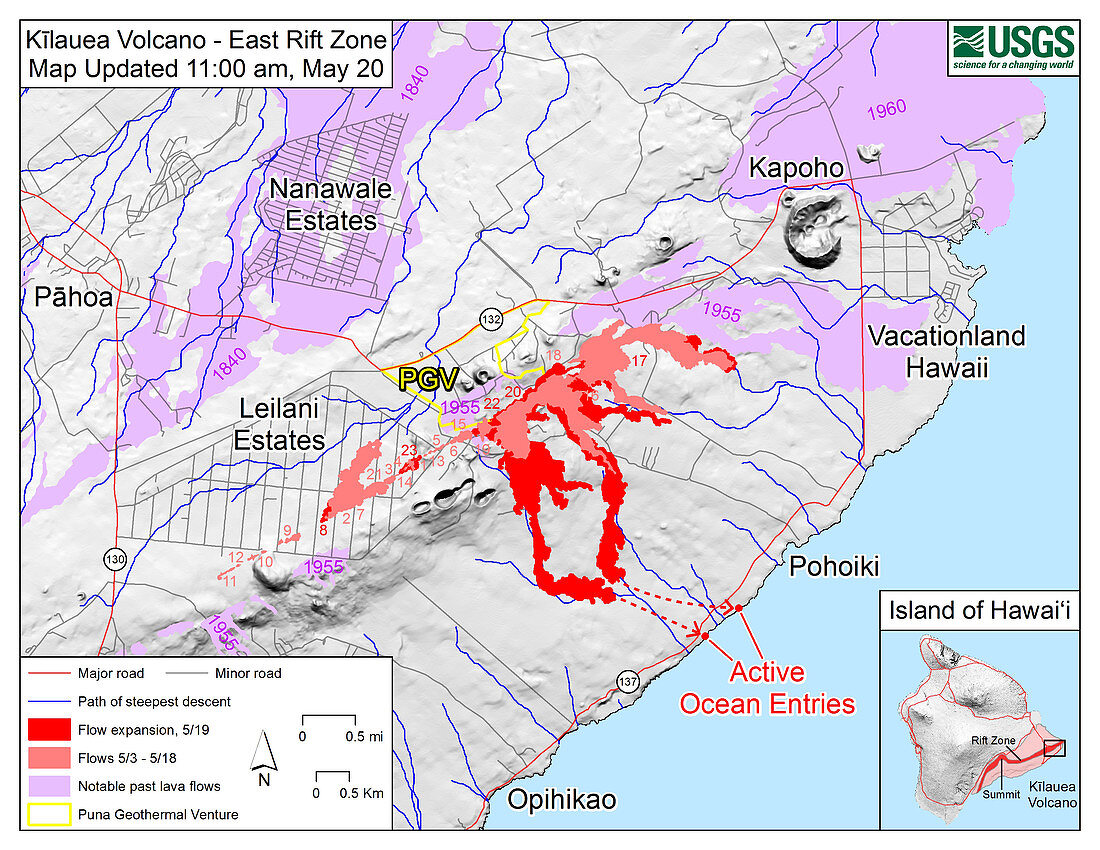
| Map showing the fissures and lava flows from Kilauea's lower East Rift Zone eruption, as of 11:00 a.m. HST, May 20, 2018. Shaded purple areas indicate historic lava flows. The 2018 lava flows are in pink, with red areas indicating active flows. Note how the lava is following the paths of steepest descent (blue lines). | |
| Lizenzart: | Lizenzpflichtig |
| Credit: | Science Photo Library / Science Source / U.S. Geological Survey |
| Bildgröße: | 3300 px × 2550 px |
| Modell-Rechte: | nicht erforderlich |
| Eigentums-Rechte: | nicht erforderlich |
| Restrictions: | - |
Preise für dieses Bild ab 15 €
Universitäten & Organisationen
(Informationsmaterial Digital, Informationsmaterial Print, Lehrmaterial Digital etc.)
ab 15 €
Redaktionell
(Bücher, Bücher: Sach- und Fachliteratur, Digitale Medien (redaktionell) etc.)
ab 30 €
Werbung
(Anzeigen, Aussenwerbung, Digitale Medien, Fernsehwerbung, Karten, Werbemittel, Zeitschriften etc.)
ab 55 €
Handelsprodukte
(bedruckte Textilie, Kalender, Postkarte, Grußkarte, Verpackung etc.)
ab 75 €
Pauschalpreise
Rechtepakete für die unbeschränkte Bildnutzung in Print oder Online
ab 495 €
Keywords
- Amerika,
- Amerikanisch,
- Diagramm,
- Erdkunde,
- geografisch,
- Geographie,
- Geologie,
- geologisch,
- Geschichte,
- Große Insel,
- Hawaii,
- Historisch,
- Illustration,
- Karte,
- Kilauea Vulkan,
- Kunstwerk,
- Naturkatastrophe,
- uns,
- USA,
- usgs,
- Vereinigte Staaten,
- Vergleich,
- Vulkan,
- Vulkane,
- vulkanisch,
- Vulkanologie,
- Zeichnung