Average sea surface topography, 2013
Bildnummer 12325540
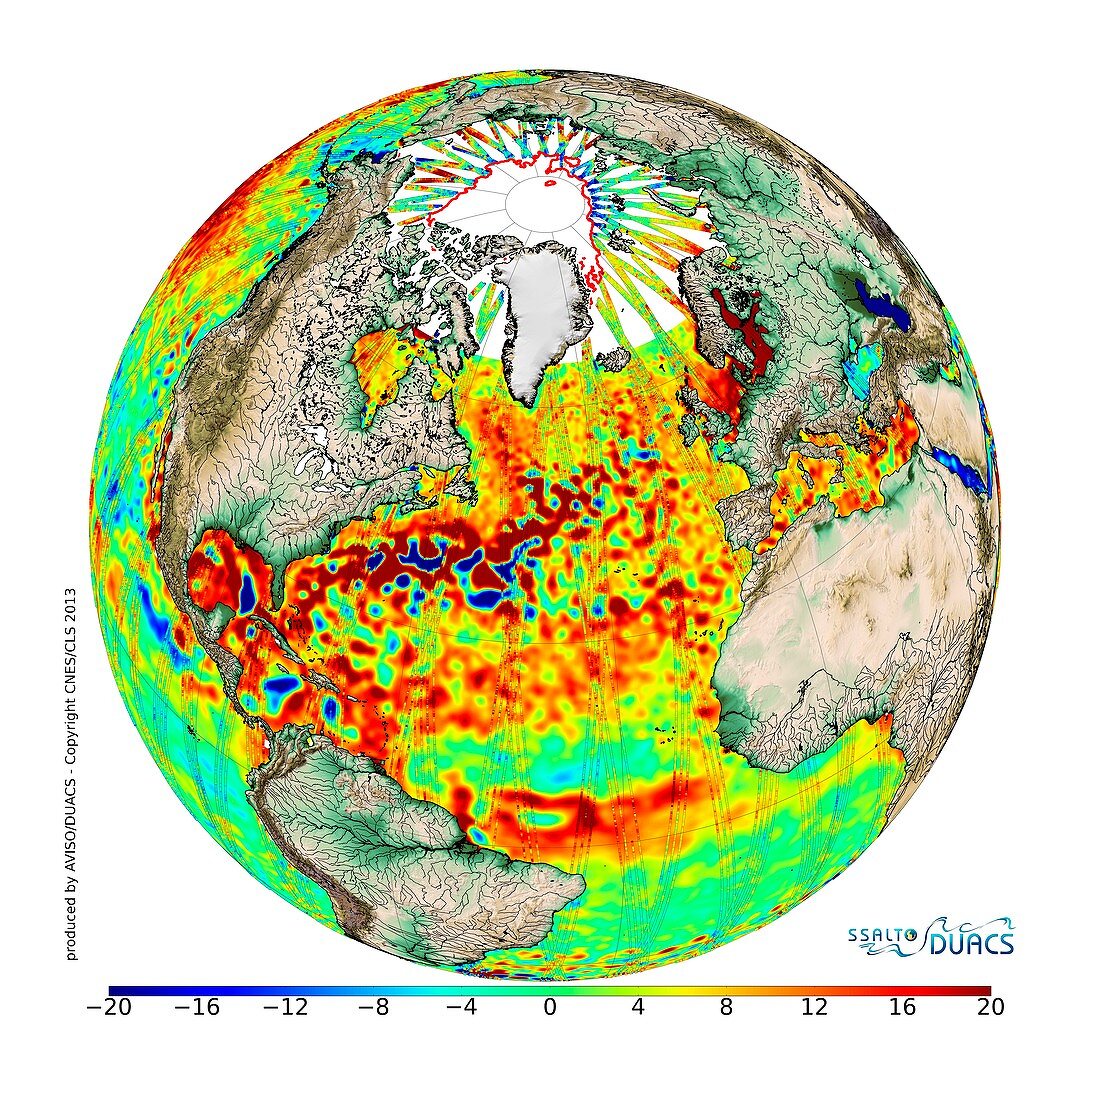
| Average sea surface topography, 2013. Computer model showing the average sea surface topography. Red represents higher sea levels (up to 20 mm) while blue represents lower areas (down to -20 mm). Image based on data recorded by the CryoSat satellite combined with data from the ERS-2, Envisat, GFO, Topex/Poseidon and Jason missions in 2013. CryoSat's ground-tracks are seen as long strips'. | |
| Lizenzart: | Lizenzpflichtig |
| Credit: | Science Photo Library / CLS / CNES / ESA |
| Bildgröße: | 5622 px × 5622 px |
| Modell-Rechte: | nicht erforderlich |
| Eigentums-Rechte: | nicht erforderlich |
| Restrictions: |
|
Preise für dieses Bild ab 15 €
Universitäten & Organisationen
(Informationsmaterial Digital, Informationsmaterial Print, Lehrmaterial Digital etc.)
ab 15 €
Redaktionell
(Bücher, Bücher: Sach- und Fachliteratur, Digitale Medien (redaktionell) etc.)
ab 30 €
Werbung
(Anzeigen, Aussenwerbung, Digitale Medien, Fernsehwerbung, Karten, Werbemittel, Zeitschriften etc.)
ab 55 €
Handelsprodukte
(bedruckte Textilie, Kalender, Postkarte, Grußkarte, Verpackung etc.)
ab 75 €
Pauschalpreise
Rechtepakete für die unbeschränkte Bildnutzung in Print oder Online
ab 495 €