Cumulative and annual CO2 emissions
Bildnummer 11720221
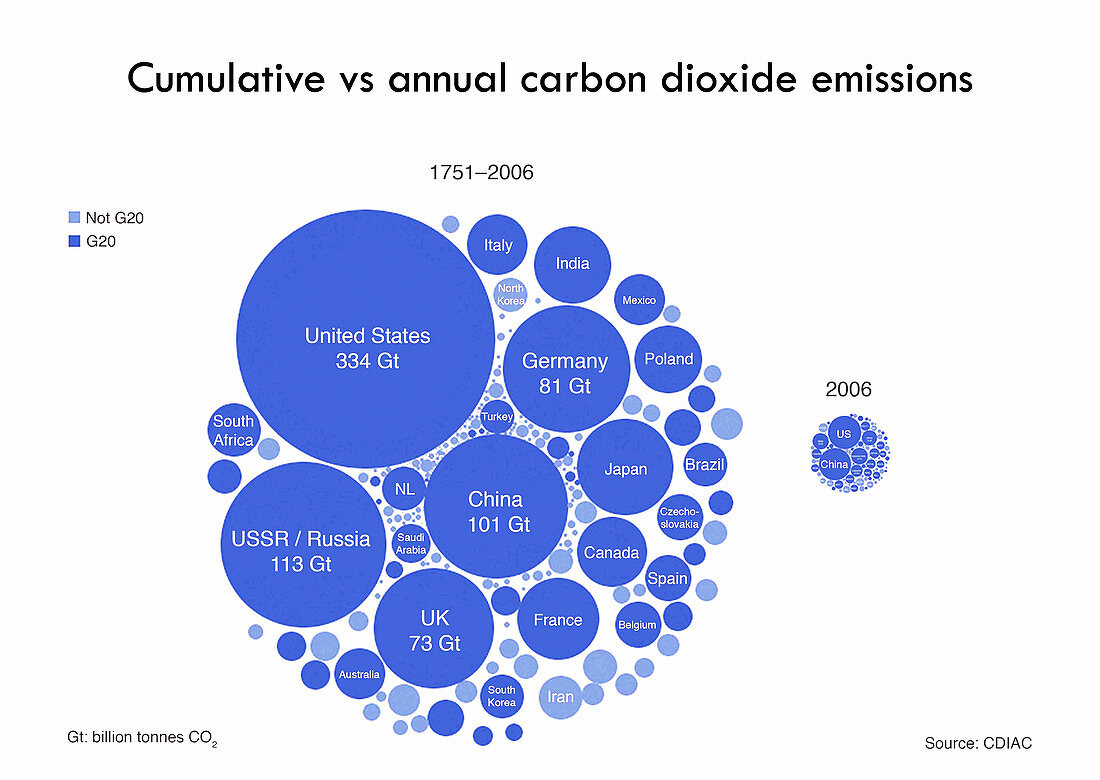
| Cumulative and annual carbon dioxide (CO2) emissions. Illustration showing the emissions over time by different countries of CO2 into the Earth's atmosphere. At centre are the CO2 emissions from 1751 to 2006,At right are the CO2 emissions in 2006. The dark blue circles indicate membership of the G20 group of industrially advanced countries. Both diagrams are to scale. The units are in gigatonnes (Gt),with 1 Gt being one billion tonnes of CO2. The USA (334 Gt) dominates,but other major contributors are USSR/Russia (113 Gt),China (101 Gt),Germany (81 Gt),and the UK (73 Gt). The data is from 2010,from CDIAC (Carbon Dioxide Information Analysis Center) | |
| Lizenzart: | Lizenzpflichtig |
| Credit: | Science Photo Library / Nieman, Adam |
| Bildgröße: | 3530 px × 2504 px |
| Modell-Rechte: | nicht erforderlich |
| Eigentums-Rechte: | nicht erforderlich |
| Restrictions: | - |
Preise für dieses Bild ab 15 €
Universitäten & Organisationen
(Informationsmaterial Digital, Informationsmaterial Print, Lehrmaterial Digital etc.)
ab 15 €
Redaktionell
(Bücher, Bücher: Sach- und Fachliteratur, Digitale Medien (redaktionell) etc.)
ab 30 €
Werbung
(Anzeigen, Aussenwerbung, Digitale Medien, Fernsehwerbung, Karten, Werbemittel, Zeitschriften etc.)
ab 55 €
Handelsprodukte
(bedruckte Textilie, Kalender, Postkarte, Grußkarte, Verpackung etc.)
ab 75 €
Pauschalpreise
Rechtepakete für die unbeschränkte Bildnutzung in Print oder Online
ab 495 €
Keywords
- 1700er Jahre,
- 18. Jahrhundert,
- 2010,
- 21. Jahrhundert,
- alljährlich,
- Amerikanisch,
- ausgeschnitten,
- Ausschnitte,
- Australien,
- Belgien,
- beschriftet,
- Brasilien,
- britisch,
- chemisch,
- China,
- Chinesisch,
- CO2-Äquivalent,
- CO2-Fußabdruck,
- CO2e,
- Deutsche,
- Deutschland,
- Emission,
- England,
- Englisch,
- Etikette,
- Etiketten,
- Europa,
- europäisch,
- Frankreich,
- Geschichte,
- Gewicht,
- Gewichte,
- Großbritannien,
- historisch,
- Höhe,
- Illustration,
- Indien,
- Industrielle Revolution,
- Iran,
- Italien,
- Japan,
- Kanada,
- Klimatologie,
- klimatologisch,
- Klimawandel,
- Kohlendioxid,
- Kunstwerk,
- Land,
- Länder,
- Maßstab,
- Mexiko,
- Nationen,
- Niederlande,
- Niemand,
- Polen,
- pro Kopf,
- Russland,
- Saudi Arabien,
- Sowjet,
- Spanien,
- Südafrika,
- Text,
- Treibhausgas,
- Truthahn,
- Umwelt,
- umweltverschmutzend,
- Umweltwissenschaften,
- USA,
- Vereinigte Staaten,
- Vereinigtes Königreich,
- Vergleich,
- vergleichen,
- visuell,
- Volumen,
- weißer Hintergrund,
- weltweit