Global climate map,1820s
Bildnummer 11703526
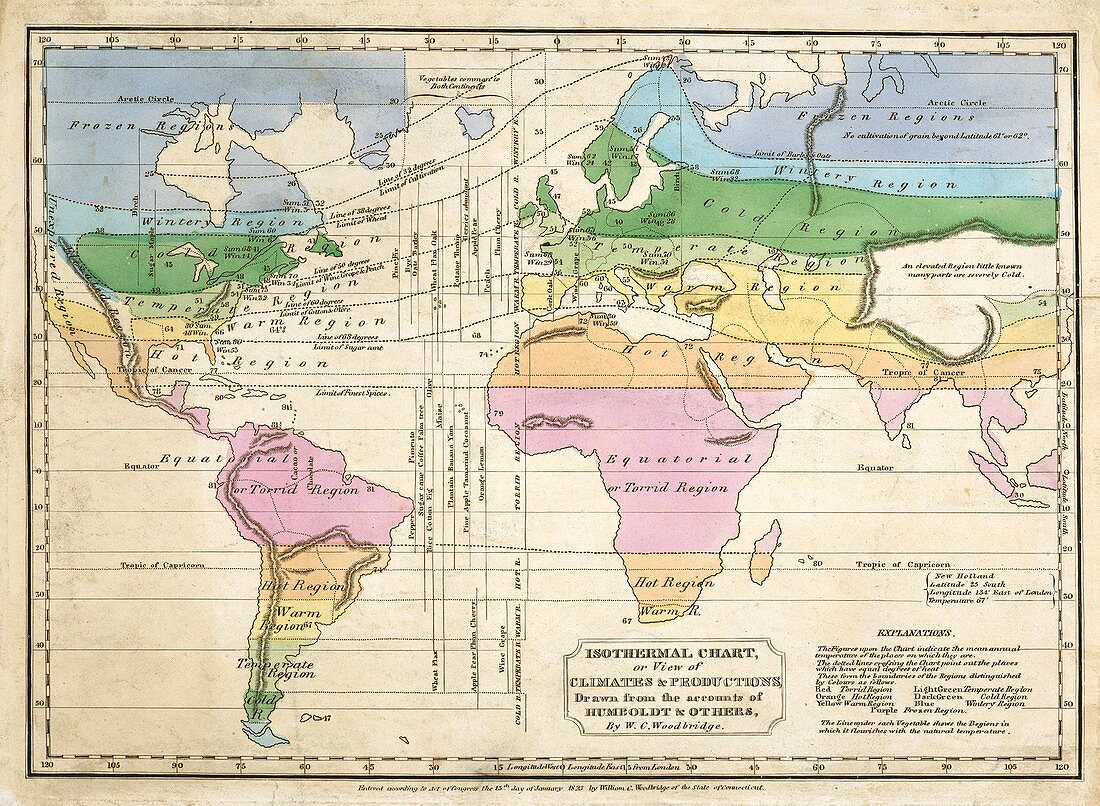
| Global climate map. 1823 map of isothermal lines and climate zones for most of the world. Drawn by US geographer William Channing Woodbridge (1794-1845) based on the accounts of German geographer Alexander von Humboldt (1769-1859) and others. The regions are colour-coded: torrid (pink),hot (orange),warm (yellow),temperate (light green),cold (dark green),wintery (blue) and frozen (purple). In the Atlantic,labels show plants common to both continents and their climate range. Examples are: sugar cane,maize,apple,orange,lemon,coffee,olive,wheat,cherry and grape. New Holland (Australia) is mentioned at lower right | |
| Lizenzart: | Lizenzpflichtig |
| Credit: | Science Photo Library / NEW YORK PUBLIC LIBRARY / The Lionel Pincus and Princess Firyal Map Division / Stephen A. Schwarzman Building |
| Bildgröße: | 3457 px × 2533 px |
| Modell-Rechte: | nicht erforderlich |
| Eigentums-Rechte: | nicht erforderlich |
| Restrictions: | - |
Preise für dieses Bild ab 15 €
Universitäten & Organisationen
(Informationsmaterial Digital, Informationsmaterial Print, Lehrmaterial Digital etc.)
ab 15 €
Redaktionell
(Bücher, Bücher: Sach- und Fachliteratur, Digitale Medien (redaktionell) etc.)
ab 30 €
Werbung
(Anzeigen, Aussenwerbung, Digitale Medien, Fernsehwerbung, Karten, Werbemittel, Zeitschriften etc.)
ab 55 €
Handelsprodukte
(bedruckte Textilie, Kalender, Postkarte, Grußkarte, Verpackung etc.)
ab 75 €
Pauschalpreise
Rechtepakete für die unbeschränkte Bildnutzung in Print oder Online
ab 495 €
Keywords
- 1800er Jahre,
- 19. Jahrhundert,
- Afrika,
- Afrikanisch,
- Alexander von Humboldt,
- Apfel,
- Äquator,
- Arktis,
- Asiatisch,
- Asien,
- Banane,
- Baumwolle,
- Beeren,
- Birne,
- Diagramm,
- Eiche,
- Erde,
- Eurasien,
- Europa,
- europäisch,
- Feige,
- Feldfrüchte,
- Flachs,
- Forschung,
- Gefroren,
- geografisch,
- Geographie,
- Geowissenschaften,
- Gerste,
- Geschichte,
- Gewürze,
- Hafer,
- heiß,
- historisch,
- Illustration,
- Kaffee,
- Kalt,
- Karte,
- Kartoffel,
- Kiefer,
- Kirsche,
- Klimatologie,
- klimatologisch,
- Kokosnuss,
- Kontinent,
- Kontinente,
- Kunstwerk,
- Land,
- Lateinamerika,
- Linien,
- Mais,
- Niemand,
- Nordamerika,
- nordamerikanisch,
- Ökologie,
- Ökologisch,
- Olive,
- Orange,
- Palme,
- Pfeffer,
- Pfirsich,
- Pflanzen,
- Pflaume,
- Piment,
- Planet,
- planetarisch,
- polar,
- Region,
- Reis,
- Roggen,
- Südamerika,
- Tamarinde,
- Tanne,
- temperent,
- Traube,
- Tropen,
- Tropisch,
- Tundra,
- Umweltwissenschaften,
- Warm,
- Weizen,
- weltweit,
- Zitrone,
- Zonen,
- Zuckerrohr