La Nina,December 2010
Bildnummer 11595623
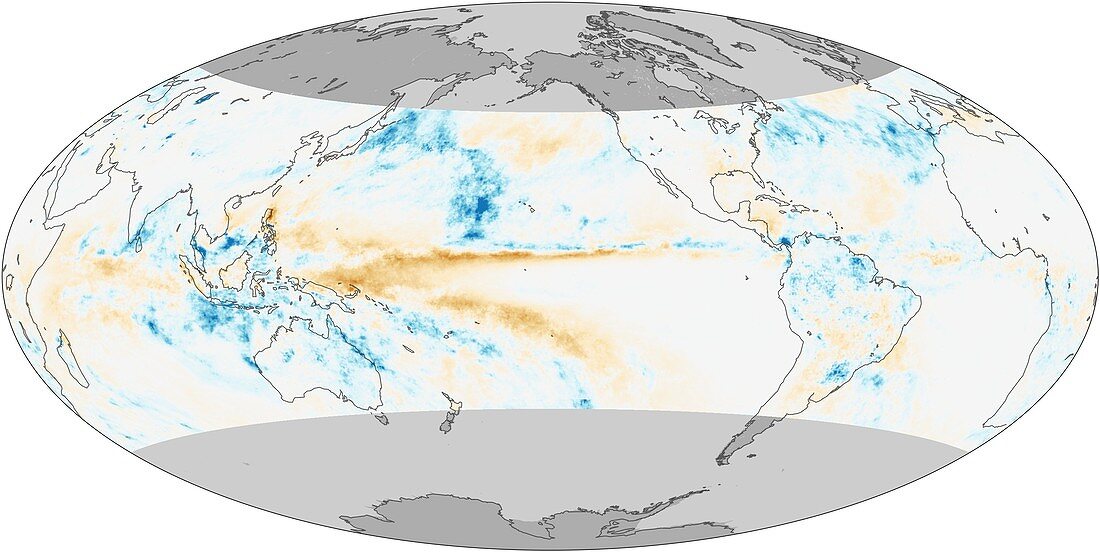
| La Nina,December 2010. Map showing total rainfall between 23rd November and 23rd December 2010 compared to the average rainfall for that period. Blue areas are above average and red areas are below average. The above average rainfall over the north-east coast of Australia and Sri Lanka,which both experienced catastrophic floods,is due to a La Nina event. La Nina effects weather systems across the world. Image obtained by the Tropical Rainfall Measuring Mission (TRMM) | |
| Lizenzart: | Lizenzpflichtig |
| Credit: | Science Photo Library / NASA |
| Bildgröße: | 4606 px × 2311 px |
| Modell-Rechte: | nicht erforderlich |
| Eigentums-Rechte: | nicht erforderlich |
| Restrictions: | - |
Preise für dieses Bild ab 15 €
Universitäten & Organisationen
(Informationsmaterial Digital, Informationsmaterial Print, Lehrmaterial Digital etc.)
ab 15 €
Redaktionell
(Bücher, Bücher: Sach- und Fachliteratur, Digitale Medien (redaktionell) etc.)
ab 30 €
Werbung
(Anzeigen, Aussenwerbung, Digitale Medien, Fernsehwerbung, Karten, Werbemittel, Zeitschriften etc.)
ab 55 €
Handelsprodukte
(bedruckte Textilie, Kalender, Postkarte, Grußkarte, Verpackung etc.)
ab 75 €
Pauschalpreise
Rechtepakete für die unbeschränkte Bildnutzung in Print oder Online
ab 495 €