Global temperature anomalies, 2018-2022
Bildnummer 13736530
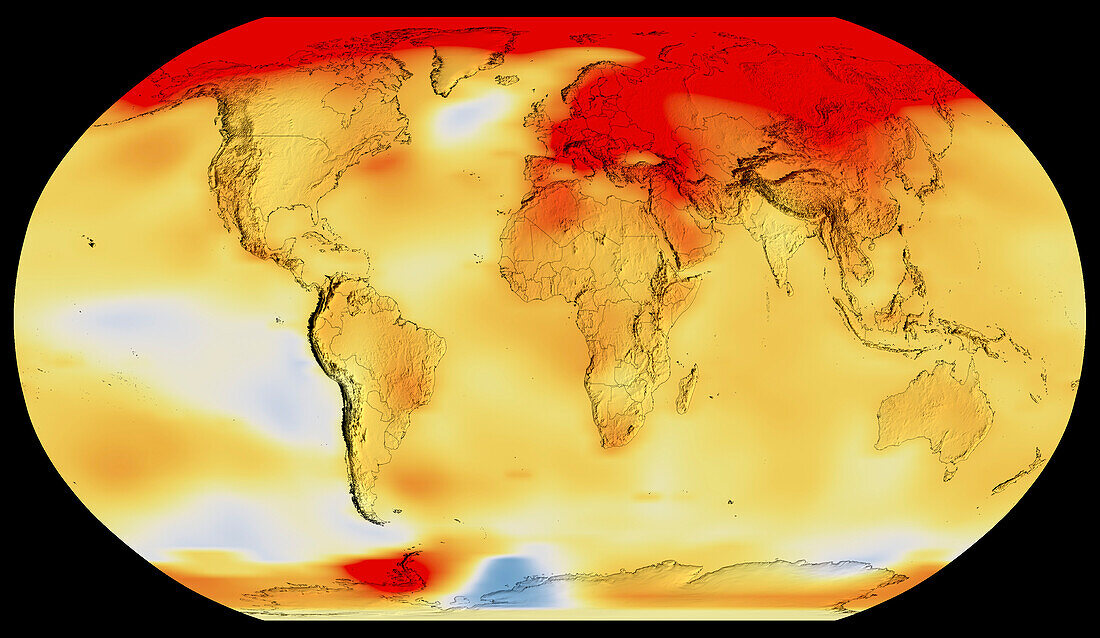
| Global temperature anomalies, 2018-2022. This image shows the average land and sea surface temperatures from 2018-2022, compared to the 1951-1980 average. Areas that are hotter than normal are red, those that are cooler are blue. 2022 tied with 2015 as the fifth warmest year since modern record-keeping began in 1880. Scientists attribute this warming to increased carbon dioxide and other greenhouse gases in the atmosphere due to human activity. | |
| Lizenzart: | Lizenzpflichtig |
| Credit: | Science Photo Library / GSFC GISS / NASA's Scientific Visualization Studio |
| Bildgröße: | 3937 px × 2283 px |
| Modell-Rechte: | nicht erforderlich |
| Eigentums-Rechte: | nicht erforderlich |
| Restrictions: | - |
Preise für dieses Bild ab 15 €
Universitäten & Organisationen
(Informationsmaterial Digital, Informationsmaterial Print, Lehrmaterial Digital etc.)
ab 15 €
Redaktionell
(Bücher, Bücher: Sach- und Fachliteratur, Digitale Medien (redaktionell) etc.)
ab 30 €
Werbung
(Anzeigen, Aussenwerbung, Digitale Medien, Fernsehwerbung, Karten, Werbemittel, Zeitschriften etc.)
ab 55 €
Handelsprodukte
(bedruckte Textilie, Kalender, Postkarte, Grußkarte, Verpackung etc.)
ab 75 €
Pauschalpreise
Rechtepakete für die unbeschränkte Bildnutzung in Print oder Online
ab 495 €
Keywords
- 2000er Jahre,
- 2018,
- 21. Jahrhundert,
- abnormal,
- Afrika,
- Antarktis,
- Arktis,
- Asiatisch,
- Asien,
- Erdbeobachtung,
- Eurasien,
- Europa,
- europäisch,
- geografisch,
- Geographie,
- Globale Erwärmung,
- Grafik,
- Illustration,
- Klima,
- Klimatologie,
- klimatologisch,
- Klimawandel,
- Kunstwerk,
- Lateinamerika,
- Meteorologie,
- meteorologisch,
- Modell-,
- Niemand,
- Nordamerika,
- nordamerikanisch,
- Ozeanien,
- Robinson-Projektion,
- schwarzer Hintergrund,
- Südamerika,
- Umwelt,
- weltweit,
- Zentralamerika