Visualisation showing changes in Antarctic ice height
Bildnummer 13475630
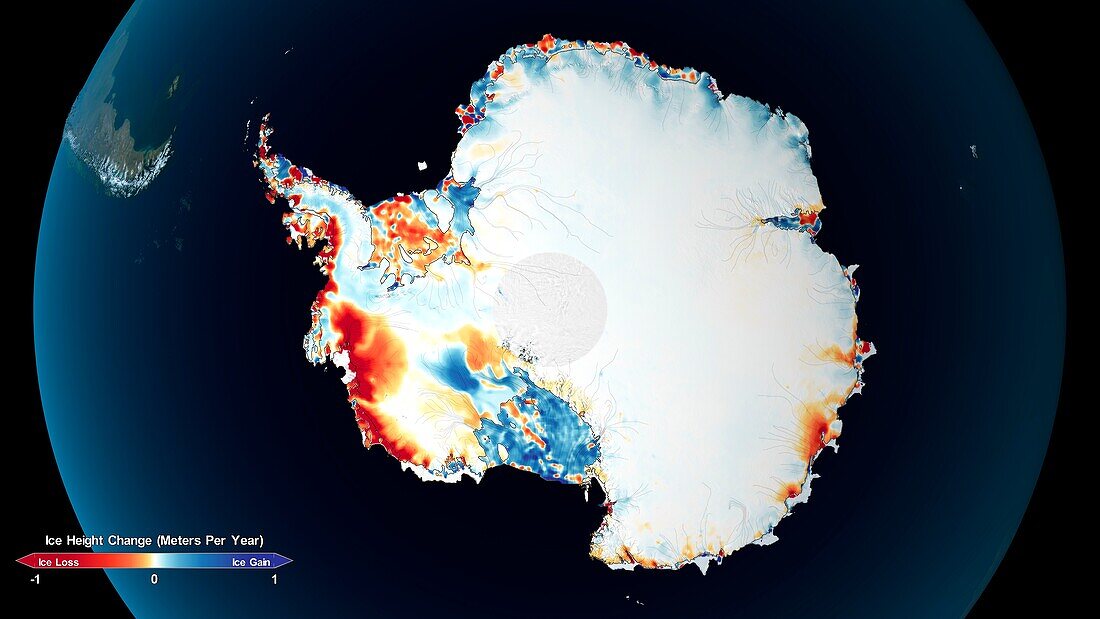
| Visualisation showing changes in ice thickness in Antarctica using data from IceSat (2003-2009) and IceSat-2 (2018-) satellites. Red-orange areas show a reduction in ice height whilst blue areas show an increase in ice height. | |
| Lizenzart: | Lizenzpflichtig |
| Credit: | Science Photo Library / NASA's Scientific Visualization Studio / NASA |
| Bildgröße: | 5760 px × 3240 px |
| Modell-Rechte: | nicht erforderlich |
| Eigentums-Rechte: | nicht erforderlich |
| Restrictions: | - |
Preise für dieses Bild ab 15 €
Universitäten & Organisationen
(Informationsmaterial Digital, Informationsmaterial Print, Lehrmaterial Digital etc.)
ab 15 €
Redaktionell
(Bücher, Bücher: Sach- und Fachliteratur, Digitale Medien (redaktionell) etc.)
ab 30 €
Werbung
(Anzeigen, Aussenwerbung, Digitale Medien, Fernsehwerbung, Karten, Werbemittel, Zeitschriften etc.)
ab 55 €
Handelsprodukte
(bedruckte Textilie, Kalender, Postkarte, Grußkarte, Verpackung etc.)
ab 75 €
Pauschalpreise
Rechtepakete für die unbeschränkte Bildnutzung in Print oder Online
ab 495 €