Western USA drought, June 2021
Bildnummer 13435643
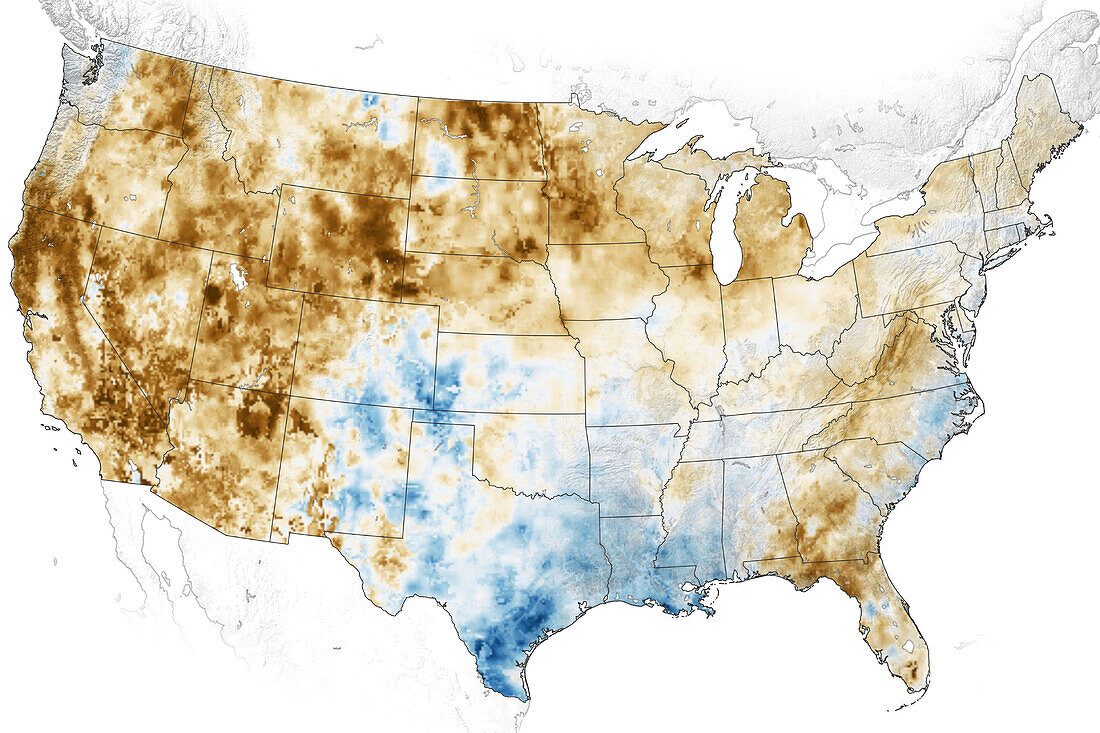
| Soil moisture anomaly map of the USA on 5th June 2021. The map shows differences from normal conditions for the time of year in the water content of the first metre of soil. White areas are normal, blue areas, increasing from light to dark, have more water, and brown areas, increasing from light to dark, have less water. Due to increased temperatures and decreased precipitation over 88 percent of the Western USA is experiencing drought conditions. Some 55 percent is experience extreme drought conditions. Data from the Crop Condition and Soil Moisture Analytics (Crop-CASMA) product, which integrates measurements from NASA's Soil Moisture Active Passive (SMAP) satellite and vegetation indices from the Moderate Resolution Imaging Spectroradiometer (MODIS) instruments on NASA's Terra and Aqua satellites. | |
| Lizenzart: | Lizenzpflichtig |
| Credit: | Science Photo Library / SERVIR / Crop-CASMA / NASA Earth Observatory |
| Bildgröße: | 5165 px × 3444 px |
| Modell-Rechte: | nicht erforderlich |
| Eigentums-Rechte: | nicht erforderlich |
| Restrictions: | - |
Preise für dieses Bild ab 15 €
Universitäten & Organisationen
(Informationsmaterial Digital, Informationsmaterial Print, Lehrmaterial Digital etc.)
ab 15 €
Redaktionell
(Bücher, Bücher: Sach- und Fachliteratur, Digitale Medien (redaktionell) etc.)
ab 30 €
Werbung
(Anzeigen, Aussenwerbung, Digitale Medien, Fernsehwerbung, Karten, Werbemittel, Zeitschriften etc.)
ab 55 €
Handelsprodukte
(bedruckte Textilie, Kalender, Postkarte, Grußkarte, Verpackung etc.)
ab 75 €
Pauschalpreise
Rechtepakete für die unbeschränkte Bildnutzung in Print oder Online
ab 495 €
Keywords
- 21. Jahrhundert,
- Amerikanisch,
- aqua,
- Arizona,
- Dürre,
- Erdbeobachtung,
- extrem,
- Globale Erwärmung,
- Idaho,
- Kalifornien,
- Karte,
- Klimatologie,
- klimatologisch,
- Klimawandel,
- meteorologisch,
- modis,
- Montana,
- New Mexico,
- Niemand,
- Oregon,
- Satellit,
- Terra,
- uns,
- Utah,
- Vereinigte Staaten,
- Washington,
- weißer Hintergrund,
- Westen,
- Western,
- Wetter,
- Zusammengesetzt