Efficiency spectrum, illustration
Bildnummer 13376902
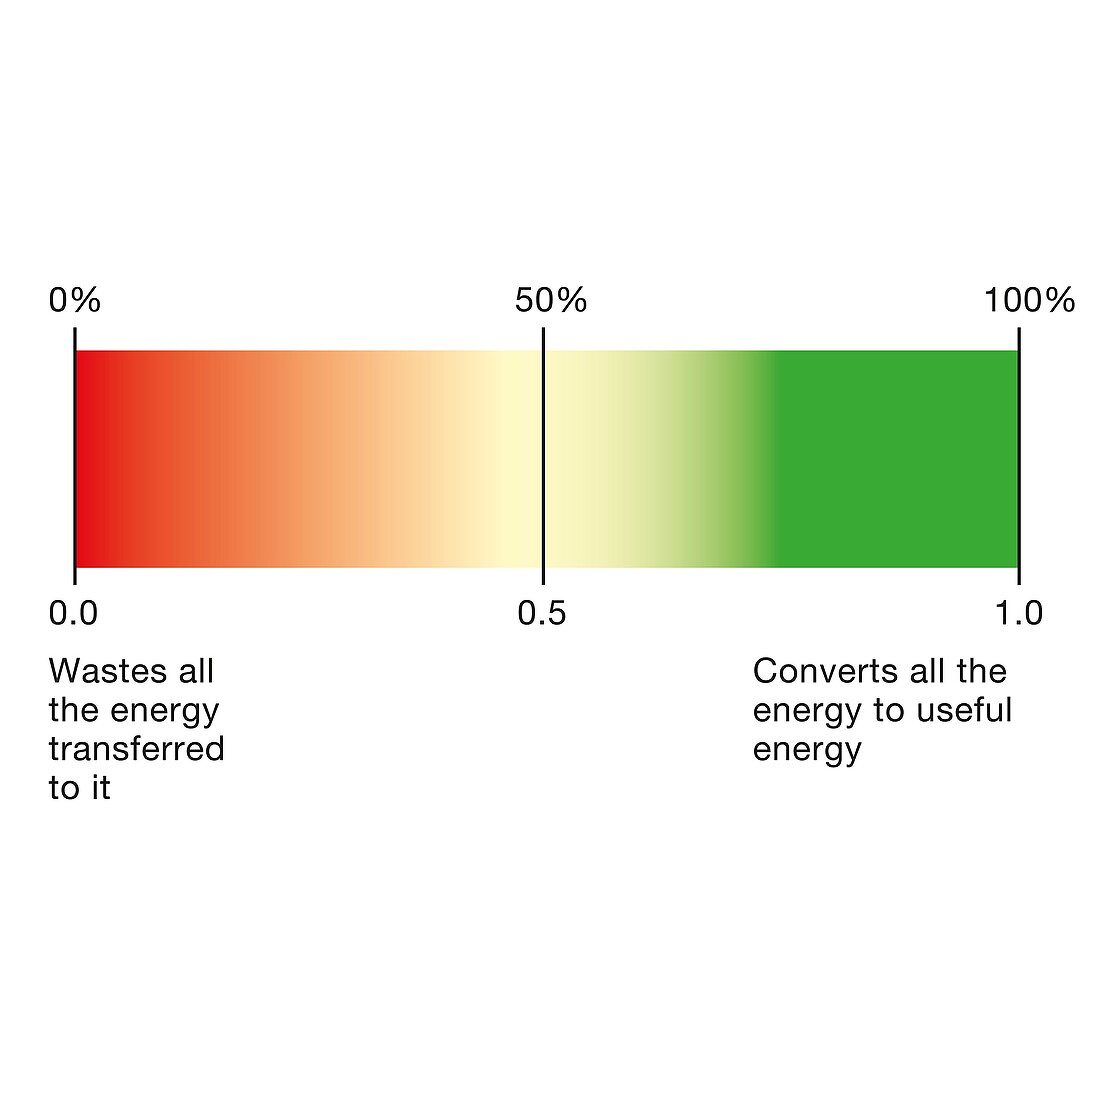
| Efficiency spectrum. Illustration of a red to green spectrum illustrating the continuous range of efficiency values. This spectrum can be used to visualise the energy efficiency of a device, process or building, and the position on the spectrum represents the ratio of useful energy available to the total energy input. | |
| Lizenzart: | Lizenzpflichtig |
| Credit: | Science Photo Library |
| Bildgröße: | 4181 px × 4181 px |
| Modell-Rechte: | nicht erforderlich |
| Eigentums-Rechte: | nicht erforderlich |
| Restrictions: | - |
Preise für dieses Bild ab 15 €
Universitäten & Organisationen
(Informationsmaterial Digital, Informationsmaterial Print, Lehrmaterial Digital etc.)
ab 15 €
Redaktionell
(Bücher, Bücher: Sach- und Fachliteratur, Digitale Medien (redaktionell) etc.)
ab 30 €
Werbung
(Anzeigen, Aussenwerbung, Digitale Medien, Fernsehwerbung, Karten, Werbemittel, Zeitschriften etc.)
ab 55 €
Handelsprodukte
(bedruckte Textilie, Kalender, Postkarte, Grußkarte, Verpackung etc.)
ab 75 €
Pauschalpreise
Rechtepakete für die unbeschränkte Bildnutzung in Print oder Online
ab 495 €
Keywords
- Bildung,
- Bildungs-,
- Diagramm,
- effizient,
- Effizienz,
- Energie,
- Energieeffizient,
- Energieeffizienz,
- Energieverbrauch,
- gcse,
- Grafik,
- Grün,
- Hitze,
- Illustration,
- Info-Grafiken,
- Infografik,
- Infografiken,
- Informationsgrafiken,
- Konzept,
- Konzepte,
- konzeptionell,
- Kunstwerk,
- Mathematik,
- mathematisch,
- Messung,
- Naturwissenschaft in der Schule,
- Niemand,
- Physik,
- physisch,
- Reduzieren,
- Reichweite,
- rot,
- Spektrum,
- Verhältnis,
- weißer Hintergrund,
- Wissenschaftspädagogik