Aerosols from US Pacific Coast wildfires, September 2020
Bildnummer 13355468
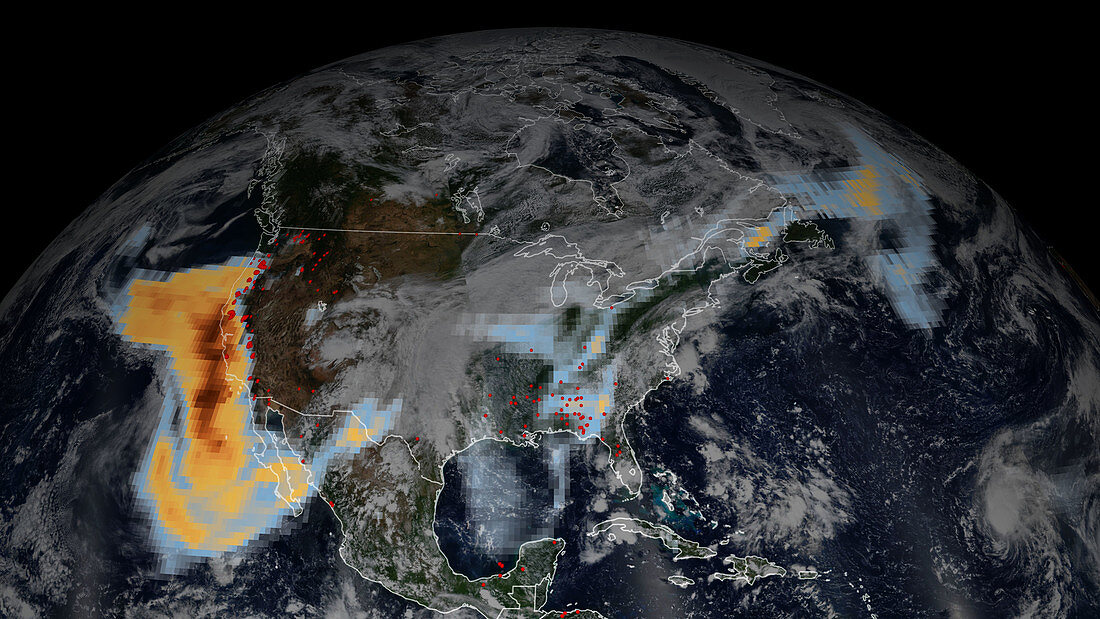
| Satellite data and map showing high levels of aerosoles in the atmosphere due to wildfires. Bright red areas indicate active wildfires. Smoke from the fires is colour-coded according to levels of aerosols, with blue areas having low levels, through yellow and orange to areas with the highest aerosol levels being dark red. The aerosols at upper right originated from the Pacific coast fires (left) and have been carried on a cold front. Since mid-August millions of acres have burned on the Pacific coast, destroying thousands of homes and killing dozens of people. Data obtained by the advanced Ozone Mapping and Profiler Suite (OMPS) on the Suomi NPP satellite on 9th September 2020. | |
| Lizenzart: | Lizenzpflichtig |
| Credit: | Science Photo Library / NASA |
| Bildgröße: | 4098 px × 2305 px |
| Modell-Rechte: | nicht erforderlich |
| Eigentums-Rechte: | nicht erforderlich |
| Restrictions: | - |
Preise für dieses Bild ab 15 €
Universitäten & Organisationen
(Informationsmaterial Digital, Informationsmaterial Print, Lehrmaterial Digital etc.)
ab 15 €
Redaktionell
(Bücher, Bücher: Sach- und Fachliteratur, Digitale Medien (redaktionell) etc.)
ab 30 €
Werbung
(Anzeigen, Aussenwerbung, Digitale Medien, Fernsehwerbung, Karten, Werbemittel, Zeitschriften etc.)
ab 55 €
Handelsprodukte
(bedruckte Textilie, Kalender, Postkarte, Grußkarte, Verpackung etc.)
ab 75 €
Pauschalpreise
Rechtepakete für die unbeschränkte Bildnutzung in Print oder Online
ab 495 €
Keywords
- 2000er Jahre,
- 21. Jahrhundert,
- Aerosole,
- Atmosphäre,
- atmosphärisch,
- Feuer,
- Globale Erwärmung,
- Kalifornien,
- Karte,
- Klimatologie,
- klimatologisch,
- Klimawandel,
- Naturkatastrophe,
- Niemand,
- Nordamerika,
- nordamerikanisch,
- Oregon,
- Rauch,
- Satellitenbild,
- Suomi NPP,
- Umwelt,
- USA,
- Vereinigte Staaten,
- Verschmutzung,
- Weltall