Land and seabed topography, Antarctica
Bildnummer 12992111
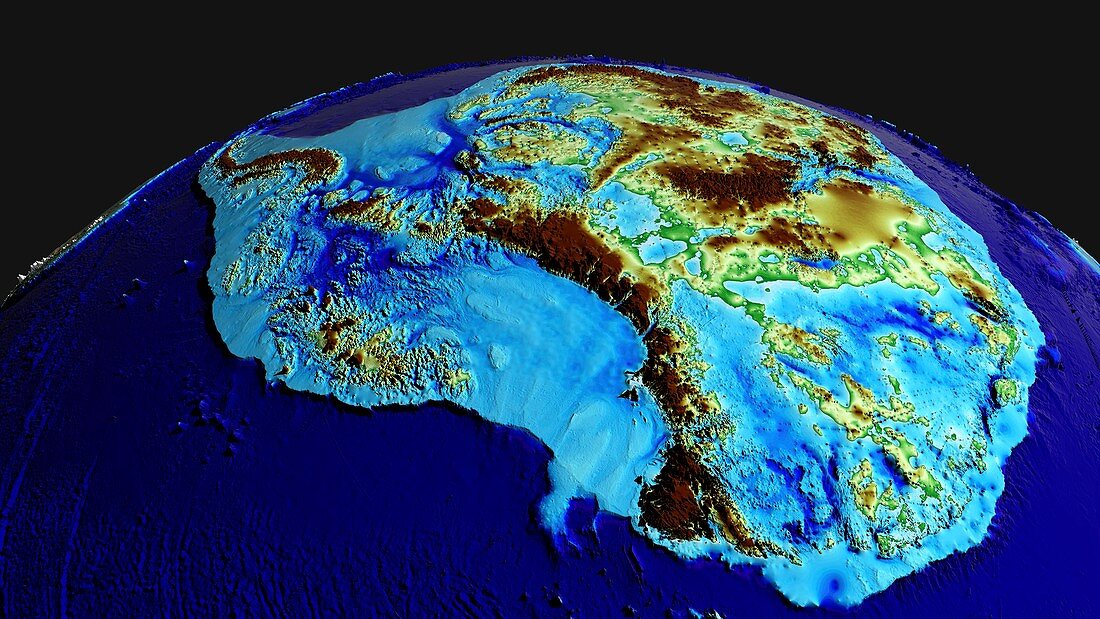
| Antarctica land and seabed topography. Elevation is colour-coded from maximum depths (dark blue) to highest elevations (red). East Antarctica is on the right. This image was created by the Antarctic BedMachine mapping project. BedMachine uses satellite data on ice flow motion to estimate what lies between radar ice thickness data sets. Understanding the underlying topography helps predict rates of ice loss and sea level rise associated with climate change. | |
| Lizenzart: | Lizenzpflichtig |
| Credit: | Science Photo Library / NASA's Scientific Visualization Studio / NASA |
| Bildgröße: | 3840 px × 2160 px |
| Modell-Rechte: | nicht erforderlich |
| Eigentums-Rechte: | nicht erforderlich |
| Restrictions: | - |
Preise für dieses Bild ab 15 €
Universitäten & Organisationen
(Informationsmaterial Digital, Informationsmaterial Print, Lehrmaterial Digital etc.)
ab 15 €
Redaktionell
(Bücher, Bücher: Sach- und Fachliteratur, Digitale Medien (redaktionell) etc.)
ab 30 €
Werbung
(Anzeigen, Aussenwerbung, Digitale Medien, Fernsehwerbung, Karten, Werbemittel, Zeitschriften etc.)
ab 55 €
Handelsprodukte
(bedruckte Textilie, Kalender, Postkarte, Grußkarte, Verpackung etc.)
ab 75 €
Pauschalpreise
Rechtepakete für die unbeschränkte Bildnutzung in Print oder Online
ab 495 €
Keywords
- 1,
- 2019,
- 21. Jahrhundert,
- Antarktis,
- Bathymetrie,
- Bett,
- Bettlacken,
- Daten,
- Eis,
- Eisdecke,
- Erdkunde,
- Erwärmen,
- farbcodiert,
- geografisch,
- Geographie,
- Geologie,
- geologisch,
- Geschmolzen,
- Gestalt,
- Gletscher,
- Gletscherspalte,
- Globale Erwärmung,
- Illustration,
- Karte,
- Klimawandel,
- Kontinent,
- Kreislauf,
- Kunstwerk,
- Küste,
- Küsten-,
- Land,
- Marine,
- maximal,
- Mechanik,
- Meer,
- Meeresboden,
- Meereskunde,
- Modell-,
- Niemand,
- Oberfläche,
- Ozean,
- Positiv,
- Rückzug,
- Schlucht,
- Schmelzen,
- Steigend,
- Tief,
- topografisch,
- Topographie,
- topographisch,
- Trog,
- Umwelt,
- unterhalb,
- Warm,
- Wasser,
- weltweit