Climate change and disease outbreaks, 2009-2018
Bildnummer 12991491
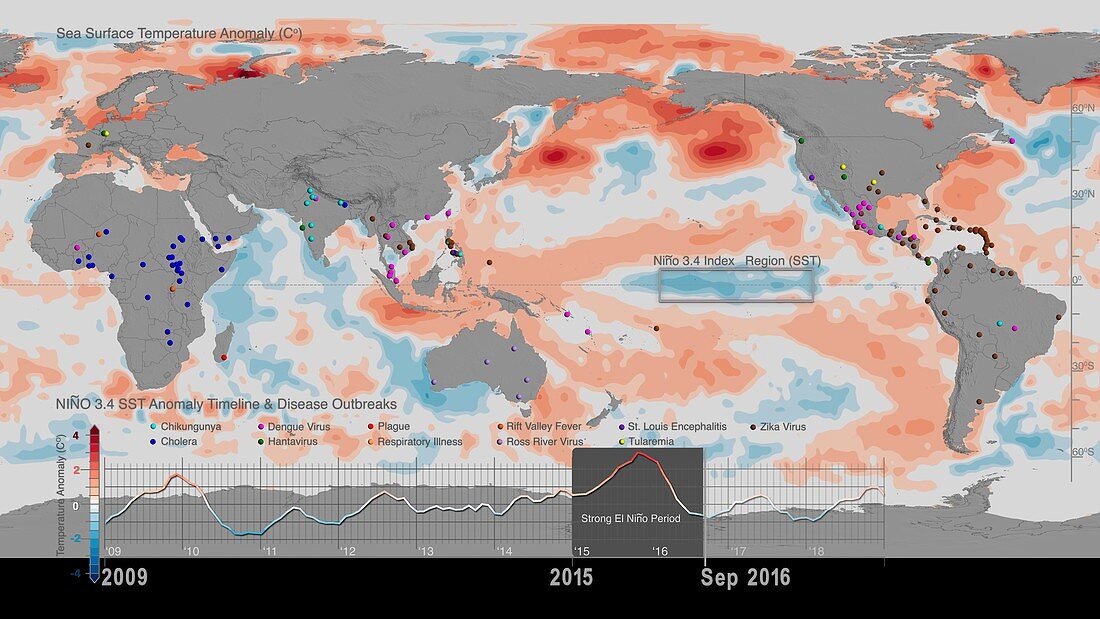
| Climate change and disease outbreaks, 2009-2018. Global map of sea surface temperature (SST) anomalies and patterns of worldwide infectious disease outbreaks in the period 2009 to 2018. This visualization shows the variability in SST anomalies with the associated ENSO (El Nino-Southern Oscillation) index timeline. Weather changes associated with the ENSO phenomenon result in rainfall, temperature and environmental anomaly conditions that help produce outbreaks of infectious diseases. The eleven diseases mapped on this visualization are: chinkungunya, cholera, dengue virus, hantavirus, plague, respiratory illness, Rift Valley fever, Ross River virus, St Louis encephalitis, tularemia and zika virus. The map combines epidemiological data and satellite data. | |
| Lizenzart: | Lizenzpflichtig |
| Credit: | Science Photo Library / NASA's Scientific Visualization Studio / NASA |
| Bildgröße: | 3840 px × 2160 px |
| Modell-Rechte: | nicht erforderlich |
| Eigentums-Rechte: | nicht erforderlich |
| Restrictions: | - |
Preise für dieses Bild ab 15 €
Universitäten & Organisationen
(Informationsmaterial Digital, Informationsmaterial Print, Lehrmaterial Digital etc.)
ab 15 €
Redaktionell
(Bücher, Bücher: Sach- und Fachliteratur, Digitale Medien (redaktionell) etc.)
ab 30 €
Werbung
(Anzeigen, Aussenwerbung, Digitale Medien, Fernsehwerbung, Karten, Werbemittel, Zeitschriften etc.)
ab 55 €
Handelsprodukte
(bedruckte Textilie, Kalender, Postkarte, Grußkarte, Verpackung etc.)
ab 75 €
Pauschalpreise
Rechtepakete für die unbeschränkte Bildnutzung in Print oder Online
ab 495 €
Keywords
- 2018,
- 21. Jahrhundert,
- Dengue-Virus,
- Distribution,
- El Nino,
- Enso,
- Erdbeobachtung,
- Erde,
- extremes Wetter,
- geografisch,
- Globale Erwärmung,
- Grafik,
- Hantavirus,
- Karte,
- Klimatologie,
- klimatologisch,
- Klimawandel,
- Kondition,
- Krankheit,
- Land,
- Meer,
- menschliche Geografie,
- Modell-,
- Niemand,
- sst,
- Störung,
- Umweltwissenschaften,
- Zika-Virus