Twenty-five years of Antarctic ice loss, 1993 to 2018
Bildnummer 12991447
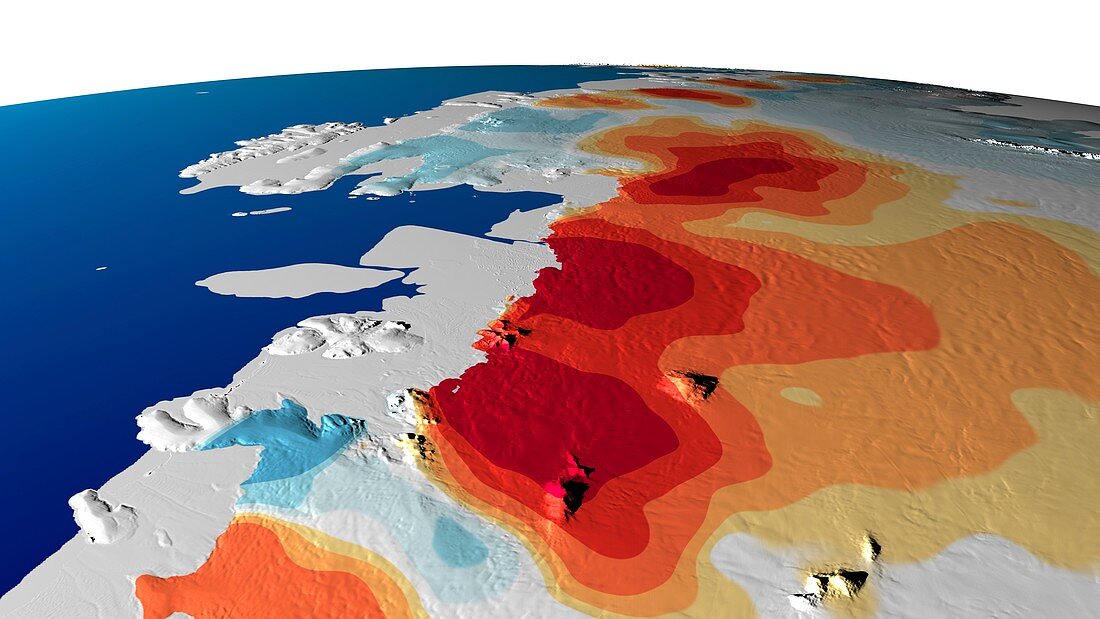
| Twenty-five years of Antarctic ice loss, 1993 to 2018. Close-up of a map of the West Antarctic Coast, part of the southern polar continent of Antarctica, with colour-coding showing land ice elevation change. Areas in red indicate land ice loss. Areas in blue are regions that saw land ice elevation gains over the 25-year period. The data was collected as part of the NASA's Measures (Making Earth Science Data Records for Use in Research Environments) programme, specifically the ITS LIVE (Inter-Mission Time Series of Land Ice Velocity and Elevation) project. Image published in 2019. | |
| Lizenzart: | Lizenzpflichtig |
| Credit: | Science Photo Library / NASA's Scientific Visualization Studio / NASA |
| Bildgröße: | 4323 px × 2432 px |
| Modell-Rechte: | nicht erforderlich |
| Eigentums-Rechte: | nicht erforderlich |
| Restrictions: | - |
Preise für dieses Bild ab 15 €
Universitäten & Organisationen
(Informationsmaterial Digital, Informationsmaterial Print, Lehrmaterial Digital etc.)
ab 15 €
Redaktionell
(Bücher, Bücher: Sach- und Fachliteratur, Digitale Medien (redaktionell) etc.)
ab 30 €
Werbung
(Anzeigen, Aussenwerbung, Digitale Medien, Fernsehwerbung, Karten, Werbemittel, Zeitschriften etc.)
ab 55 €
Handelsprodukte
(bedruckte Textilie, Kalender, Postkarte, Grußkarte, Verpackung etc.)
ab 75 €
Pauschalpreise
Rechtepakete für die unbeschränkte Bildnutzung in Print oder Online
ab 495 €
Keywords
- 1,
- 20. Jahrhundert,
- 2018,
- 21. Jahrhundert,
- Antarktis,
- Close-up,
- Detail,
- Eis,
- Eisdecke,
- eisig,
- Erdbeobachtung,
- Gefroren,
- Geowissenschaften,
- Geschichte,
- Glaziologie,
- Globale Erwärmung,
- historisch,
- Kalt,
- Karte,
- Klimatologie,
- klimatologisch,
- Klimawandel,
- Küste,
- Modell-,
- Niemand,
- polar,
- Süd-,
- Trend,
- Veränderung,
- weißer Hintergrund