July 2019 European heat wave,temperature difference map
Bildnummer 12896671
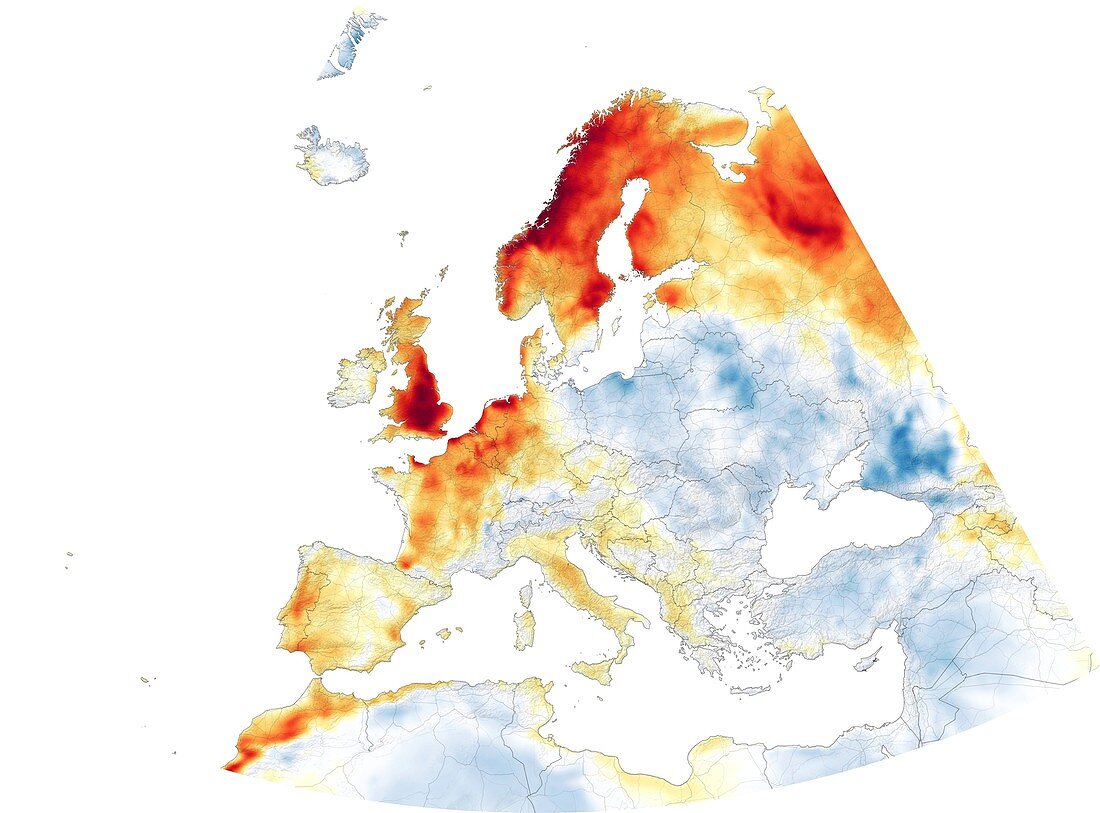
| July 2019 European heat wave,temperature difference map. The colour-coding shows the air temperature difference between 26 June and 25 July,ranging from 15 degrees Celsius cooler in July (light to dark blue) to 15 degrees Celsius warmer in July (yellow to orange to red). Several countries in Europe saw record-breaking temperatures during this heatwave,which was caused by a large area of high pressure (a heat dome) over the region. The resulting disruption of the jet stream drew hot air north from the Sahara Desert. An increase in the number and severity of regional heatwaves has been linked with global warming. This image was produced using data from the Goddard Earth Observing System-5 (GEOS-5) model. | |
| Lizenzart: | Lizenzpflichtig |
| Credit: | Science Photo Library / NASA |
| Bildgröße: | 3500 px × 2588 px |
| Modell-Rechte: | nicht erforderlich |
| Eigentums-Rechte: | nicht erforderlich |
| Restrictions: | - |
Preise für dieses Bild ab 15 €
Universitäten & Organisationen
(Informationsmaterial Digital, Informationsmaterial Print, Lehrmaterial Digital etc.)
ab 15 €
Redaktionell
(Bücher, Bücher: Sach- und Fachliteratur, Digitale Medien (redaktionell) etc.)
ab 30 €
Werbung
(Anzeigen, Aussenwerbung, Digitale Medien, Fernsehwerbung, Karten, Werbemittel, Zeitschriften etc.)
ab 55 €
Handelsprodukte
(bedruckte Textilie, Kalender, Postkarte, Grußkarte, Verpackung etc.)
ab 75 €
Pauschalpreise
Rechtepakete für die unbeschränkte Bildnutzung in Print oder Online
ab 495 €