Global atmospheric carbon dioxide, 3D model
Bildnummer 12394560
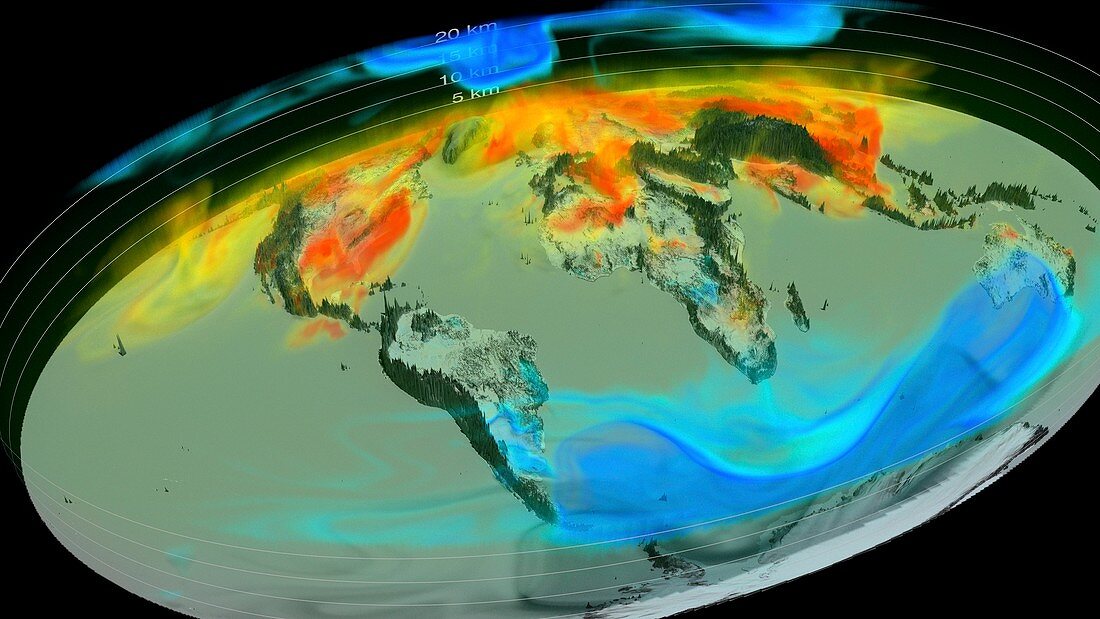
| Global atmospheric carbon dioxide. 3D visualization showing the complex patterns by which carbon dioxide in the atmosphere increases, decreases and moves around the globe with the seasons and the weather. Blue areas are below average (CO2 absorption), while red-yellow areas are above average (CO2 accumulation). The visualisation covered the period from September 2014 to September 2015. This still image shows the levels of carbon dioxide on 12 December 2014. This model of carbon dioxide levels was produced by NASA's Global Modeling and Assimilation Office using data from the Orbiting Carbon Observatory-2 (OCO-2) satellite. | |
| Lizenzart: | Lizenzpflichtig |
| Credit: | Science Photo Library / NASA's Scientific Visualization Studio / NASA |
| Bildgröße: | 4323 px × 2432 px |
| Modell-Rechte: | nicht erforderlich |
| Eigentums-Rechte: | nicht erforderlich |
| Restrictions: | - |
Preise für dieses Bild ab 15 €
Universitäten & Organisationen
(Informationsmaterial Digital, Informationsmaterial Print, Lehrmaterial Digital etc.)
ab 15 €
Redaktionell
(Bücher, Bücher: Sach- und Fachliteratur, Digitale Medien (redaktionell) etc.)
ab 30 €
Werbung
(Anzeigen, Aussenwerbung, Digitale Medien, Fernsehwerbung, Karten, Werbemittel, Zeitschriften etc.)
ab 55 €
Handelsprodukte
(bedruckte Textilie, Kalender, Postkarte, Grußkarte, Verpackung etc.)
ab 75 €
Pauschalpreise
Rechtepakete für die unbeschränkte Bildnutzung in Print oder Online
ab 495 €
Keywords
- 2014,
- 21. Jahrhundert,
- 3D,
- absorbierend,
- Absorption,
- Atmosphäre,
- atmosphärisch,
- Ebenen,
- Erde,
- Erdkunde,
- farbcodiert,
- Globale Erwärmung,
- Jahr,
- Jahreszeit,
- Jahreszeiten,
- Karte,
- Klimatologie,
- klimatologisch,
- Klimawandel,
- Kohlendioxid,
- Kohlenstoff,
- Land,
- Modell-,
- NASA,
- Niemand,
- Ozeane,
- Planet,
- planetarisch,
- Produktion,
- saisonal,
- Satellit,
- Satellitenbild,
- schwarzer Hintergrund,
- Treibhausgas,
- Weltall,
- weltweit,
- Winter