GLOBE world map showing Ice Age sea levels
Bildnummer 12361538
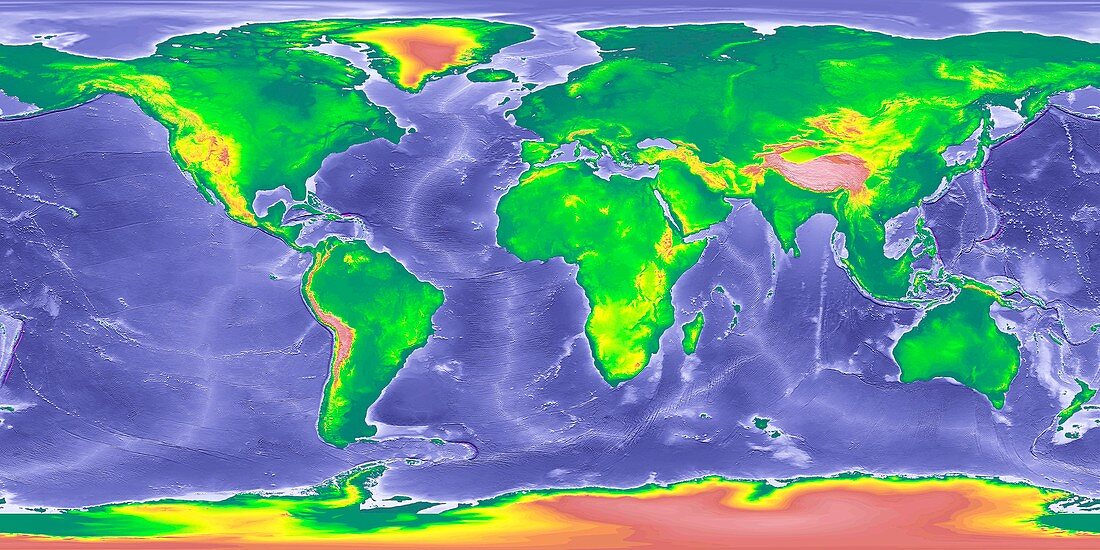
| GLOBE world map showing Ice Age sea levels. Topographic world map showing global elevations and bathymetry during the peak of the last ice age, about 18, 000 years ago. At this point, mean sea level was 110 metres below the present level. Colours on land indicate elevation above sea level, with the the colour-coding (low to high) ranging from green through yellow and red to white. GLOBE (Global Land One-kilometer Base Elevation) is a global digital elevation model (DEM), produced by the National Geophysical Data Center (NGDC) of the National Oceanic and Atmospheric Administration (NOAA). Since 2015, GLOBE data has been collated and published by NOAA's National Centers for Environmental Information (NCEI). | |
| Lizenzart: | Lizenzpflichtig |
| Credit: | Science Photo Library / NOAA |
| Bildgröße: | 7247 px × 3624 px |
| Modell-Rechte: | nicht erforderlich |
| Eigentums-Rechte: | nicht erforderlich |
| Restrictions: |
|
Preise für dieses Bild ab 15 €
Universitäten & Organisationen
(Informationsmaterial Digital, Informationsmaterial Print, Lehrmaterial Digital etc.)
ab 15 €
Redaktionell
(Bücher, Bücher: Sach- und Fachliteratur, Digitale Medien (redaktionell) etc.)
ab 30 €
Werbung
(Anzeigen, Aussenwerbung, Digitale Medien, Fernsehwerbung, Karten, Werbemittel, Zeitschriften etc.)
ab 55 €
Handelsprodukte
(bedruckte Textilie, Kalender, Postkarte, Grußkarte, Verpackung etc.)
ab 75 €
Pauschalpreise
Rechtepakete für die unbeschränkte Bildnutzung in Print oder Online
ab 495 €