Penrose diagram
Bildnummer 12098995
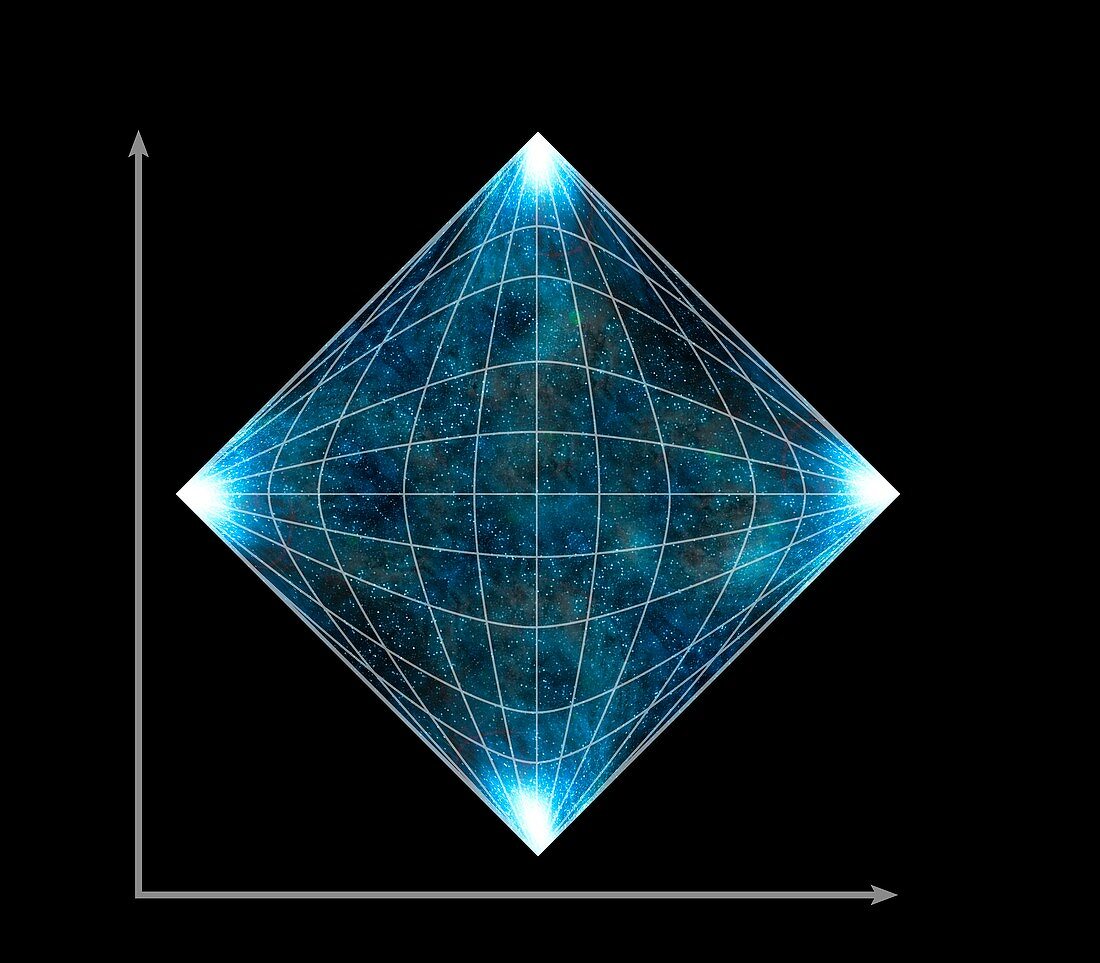
| Penrose diagram. Penrose diagrams (named after Roger Penrose) are a way to represent events occurring in spacetime,with time on one axis (left) and space on the other (bottom). Light travels at a 45-degree angle to the time axis and the same angle to the space axis. The lines in the diagram trace hyperbolas and converge at the corners,which are the points of infinity in time and space. Penrose diagrams can be used to represent the path of light rays and the spacetime properties of different types of black holes and other singularities. For this diagram with labels and a photon ray,see image C030/2323 | |
| Lizenzart: | Lizenzpflichtig |
| Credit: | Science Photo Library / Lunau, Claus |
| Bildgröße: | 4724 px × 4134 px |
| Modell-Rechte: | nicht erforderlich |
| Eigentums-Rechte: | nicht erforderlich |
| Restrictions: | - |
Preise für dieses Bild ab 15 €
Universitäten & Organisationen
(Informationsmaterial Digital, Informationsmaterial Print, Lehrmaterial Digital etc.)
ab 15 €
Redaktionell
(Bücher, Bücher: Sach- und Fachliteratur, Digitale Medien (redaktionell) etc.)
ab 30 €
Werbung
(Anzeigen, Aussenwerbung, Digitale Medien, Fernsehwerbung, Karten, Werbemittel, Zeitschriften etc.)
ab 55 €
Handelsprodukte
(bedruckte Textilie, Kalender, Postkarte, Grußkarte, Verpackung etc.)
ab 75 €
Pauschalpreise
Rechtepakete für die unbeschränkte Bildnutzung in Print oder Online
ab 495 €