Coastal dead zones,global satellite map
Bildnummer 12098798
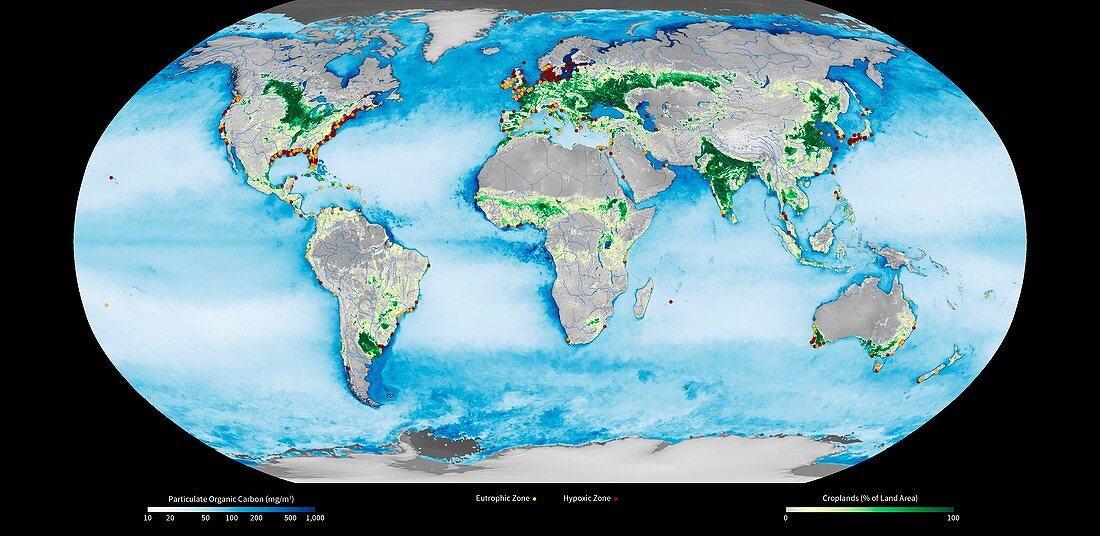
| Coastal dead zones. Global satellite map showing the distribution of croplands (green),marine coastal dead zones (hypoxic zones,red dots),eutropic zones (yellow dots),and levels of particulate organic carbon (POC,blue),a measure of water quality. The eutrophic zones are where fertiliser run-off causes algal blooms that can deplete the water of oxygen and cause hypoxic zones,resulting in severe and mass loss of fish and other sea life. The eutrophication and hypoxia data set is from the Virginia Institute of Marine Science (VIMS) and the World Resources Institute (WRI). The POC data is from the Visible Infrared Imaging Radiometer Suite (VIIRS) on the Suomi National Polar-orbiting Partnership (NPP) weather satellite | |
| Lizenzart: | Lizenzpflichtig |
| Credit: | Science Photo Library / NASA's Goddard Space Flight Center |
| Bildgröße: | 4724 px × 2304 px |
| Modell-Rechte: | nicht erforderlich |
| Eigentums-Rechte: | nicht erforderlich |
| Restrictions: | - |
Preise für dieses Bild ab 15 €
Universitäten & Organisationen
(Informationsmaterial Digital, Informationsmaterial Print, Lehrmaterial Digital etc.)
ab 15 €
Redaktionell
(Bücher, Bücher: Sach- und Fachliteratur, Digitale Medien (redaktionell) etc.)
ab 30 €
Werbung
(Anzeigen, Aussenwerbung, Digitale Medien, Fernsehwerbung, Karten, Werbemittel, Zeitschriften etc.)
ab 55 €
Handelsprodukte
(bedruckte Textilie, Kalender, Postkarte, Grußkarte, Verpackung etc.)
ab 75 €
Pauschalpreise
Rechtepakete für die unbeschränkte Bildnutzung in Print oder Online
ab 495 €
Keywords
- 2013,
- 21. Jahrhundert,
- Algen,
- beschriftet,
- Dünger,
- Erdbeobachtung,
- Erde,
- Etikette,
- farbcodiert,
- Feldfrüchte,
- geografisch,
- Geographie,
- getötet,
- Grafik,
- Karte,
- Küste,
- Küsten-,
- Landwirtschaft,
- landwirtschaftlich,
- Maßstab,
- Meereskunde,
- Niemand,
- NPP,
- Satellit,
- Satellitenbild,
- Schlüssel,
- schwarzer Hintergrund,
- toter Fisch,
- Umweltwissenschaften,
- viirs,
- VIMS,
- Welt,
- Weltall,
- weltweit