Star classification
Bildnummer 11885388
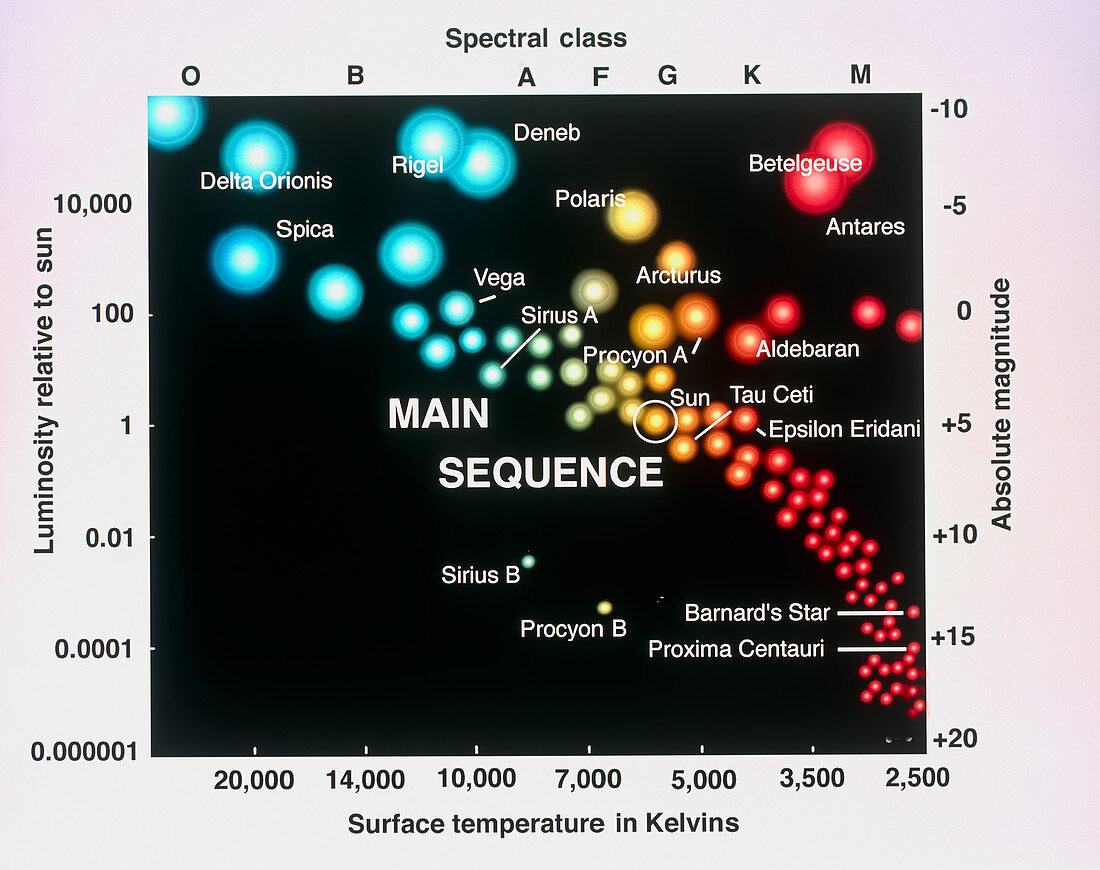
| Stellar classification using a Hertzsprung-Russell diagram,a graph that plots the absolute magnitude (luminosity relative to the Sun) of a star against its surface temperature. This shows most stars on the main sequence curve (from lower right to upper left). A new star's position on the sequence depends upon its mass. Low-mass stars are cool and red. Medium-mass stars (like the Sun,circled) are yellow. High-mass stars are hot & blue. A medium- mass star leaves this curve at the end of its life as it expands and cools,moving right and above the curve as a red giant (like Betelguese,upper right). It then contracts to a white dwarf (like Sirius B,lower centre),ending below the curve | |
| Lizenzart: | Lizenzpflichtig |
| Credit: | Science Photo Library / Lomberg, Jon |
| Bildgröße: | 4724 px × 3735 px |
| Modell-Rechte: | nicht erforderlich |
| Eigentums-Rechte: | nicht erforderlich |
| Restrictions: | - |
Preise für dieses Bild ab 15 €
Universitäten & Organisationen
(Informationsmaterial Digital, Informationsmaterial Print, Lehrmaterial Digital etc.)
ab 15 €
Redaktionell
(Bücher, Bücher: Sach- und Fachliteratur, Digitale Medien (redaktionell) etc.)
ab 30 €
Werbung
(Anzeigen, Aussenwerbung, Digitale Medien, Fernsehwerbung, Karten, Werbemittel, Zeitschriften etc.)
ab 55 €
Handelsprodukte
(bedruckte Textilie, Kalender, Postkarte, Grußkarte, Verpackung etc.)
ab 75 €
Pauschalpreise
Rechtepakete für die unbeschränkte Bildnutzung in Print oder Online
ab 495 €