Thermogram of heat over domestic house
Bildnummer 11832627
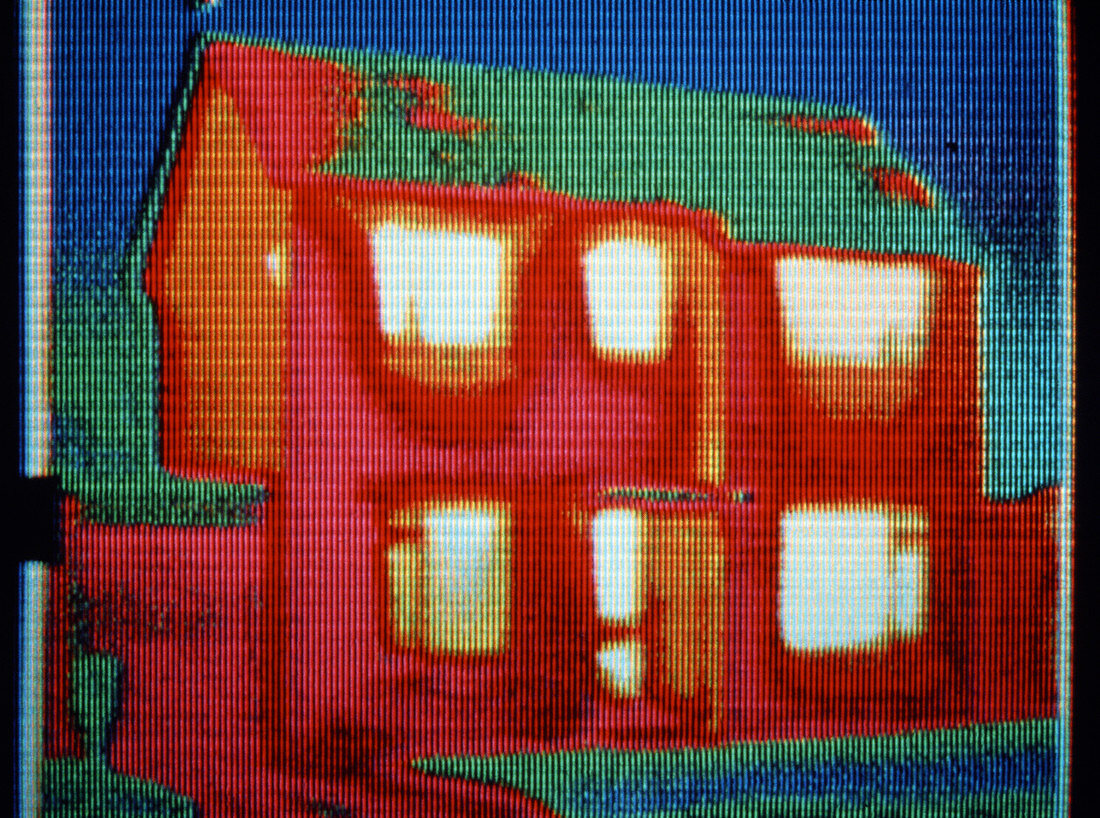
| Thermograph showing the distribution of heat overthe external surface of a domestic house. The colour coding ranges from white and orange for the warmest areas through to green and blue for the coolest. The picture shows that the greatest heat loss is through the single-glazed windows. The roof is relatively well insulated,but there is heat loss indicated by the red areas | |
| Lizenzart: | Lizenzpflichtig |
| Credit: | Science Photo Library / Aga Infrared Systems |
| Bildgröße: | 4350 px × 3234 px |
| Modell-Rechte: | nicht erforderlich |
| Eigentums-Rechte: | nicht erforderlich |
| Restrictions: | - |
Preise für dieses Bild ab 15 €
Universitäten & Organisationen
(Informationsmaterial Digital, Informationsmaterial Print, Lehrmaterial Digital etc.)
ab 15 €
Redaktionell
(Bücher, Bücher: Sach- und Fachliteratur, Digitale Medien (redaktionell) etc.)
ab 30 €
Werbung
(Anzeigen, Aussenwerbung, Digitale Medien, Fernsehwerbung, Karten, Werbemittel, Zeitschriften etc.)
ab 55 €
Handelsprodukte
(bedruckte Textilie, Kalender, Postkarte, Grußkarte, Verpackung etc.)
ab 75 €
Pauschalpreise
Rechtepakete für die unbeschränkte Bildnutzung in Print oder Online
ab 495 €