Yeast protein interaction map
Bildnummer 11818487
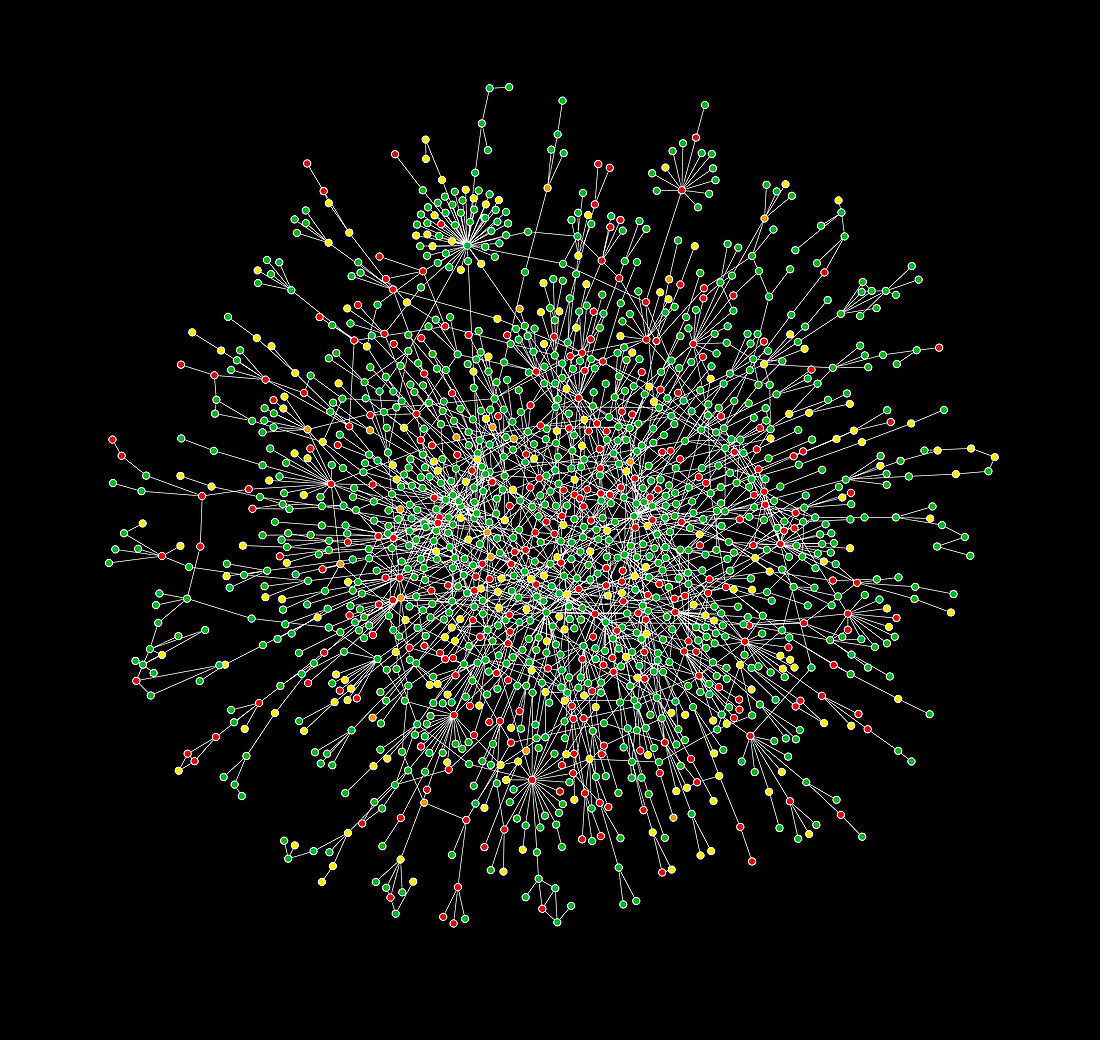
| Yeast protein map. Map showing the relationships between proteins in the yeast Saccharomyces cere- visiae. Each dot represents one of the proteins found in this single-celled fungus. Lines link proteins that interact with each other. Proteins are colour-coded by the effect their removal has on the yeast: removal of red proteins was lethal,green was not lethal,orange caused slower growth and yellow had unknown effects. The proteins were removed by removing the gene that coded for their production. The more highly-connected proteins are more important for life. Work done by Jeong et al,at the University of Notre Dame,Indiana,USA | |
| Lizenzart: | Lizenzpflichtig |
| Credit: | Science Photo Library |
| Bildgröße: | 6361 px × 6013 px |
| Modell-Rechte: | nicht erforderlich |
| Eigentums-Rechte: | nicht erforderlich |
| Restrictions: | - |
Preise für dieses Bild ab 15 €
Universitäten & Organisationen
(Informationsmaterial Digital, Informationsmaterial Print, Lehrmaterial Digital etc.)
ab 15 €
Redaktionell
(Bücher, Bücher: Sach- und Fachliteratur, Digitale Medien (redaktionell) etc.)
ab 30 €
Werbung
(Anzeigen, Aussenwerbung, Digitale Medien, Fernsehwerbung, Karten, Werbemittel, Zeitschriften etc.)
ab 55 €
Handelsprodukte
(bedruckte Textilie, Kalender, Postkarte, Grußkarte, Verpackung etc.)
ab 75 €
Pauschalpreise
Rechtepakete für die unbeschränkte Bildnutzung in Print oder Online
ab 495 €