False-col satellite image of world's oceans
Bildnummer 11739595
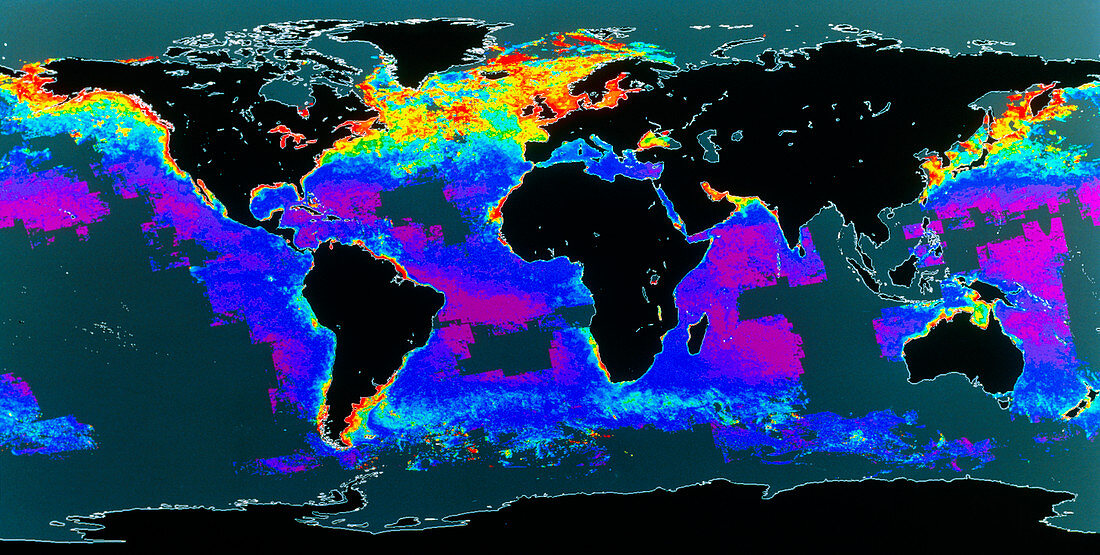
| False-colour satellite image of the world's oceans,showing the distribution of phytoplankton in the surface water. The colours represent varying phytoplankton densities from red (most dense) through yellow,green and blue to violet (least dense). Grey areas are data gaps. This image is an average of distributions for April- June 1979 and shows the blooming of phytoplankton over the entire North Atlantic during the northern spring. The image was produced from data acquired by the Coastal Zone Colour Scanner,one of the instruments on NASA's Nimbus-7 research satellite | |
| Lizenzart: | Lizenzpflichtig |
| Credit: | Science Photo Library / DR GENE FELDMAN, NASA GSFC |
| Bildgröße: | 5301 px × 2673 px |
| Modell-Rechte: | nicht erforderlich |
| Eigentums-Rechte: | nicht erforderlich |
| Restrictions: | - |
Preise für dieses Bild ab 15 €
Universitäten & Organisationen
(Informationsmaterial Digital, Informationsmaterial Print, Lehrmaterial Digital etc.)
ab 15 €
Redaktionell
(Bücher, Bücher: Sach- und Fachliteratur, Digitale Medien (redaktionell) etc.)
ab 30 €
Werbung
(Anzeigen, Aussenwerbung, Digitale Medien, Fernsehwerbung, Karten, Werbemittel, Zeitschriften etc.)
ab 55 €
Handelsprodukte
(bedruckte Textilie, Kalender, Postkarte, Grußkarte, Verpackung etc.)
ab 75 €
Pauschalpreise
Rechtepakete für die unbeschränkte Bildnutzung in Print oder Online
ab 495 €