Greenhouse Effect research
Bildnummer 11738714
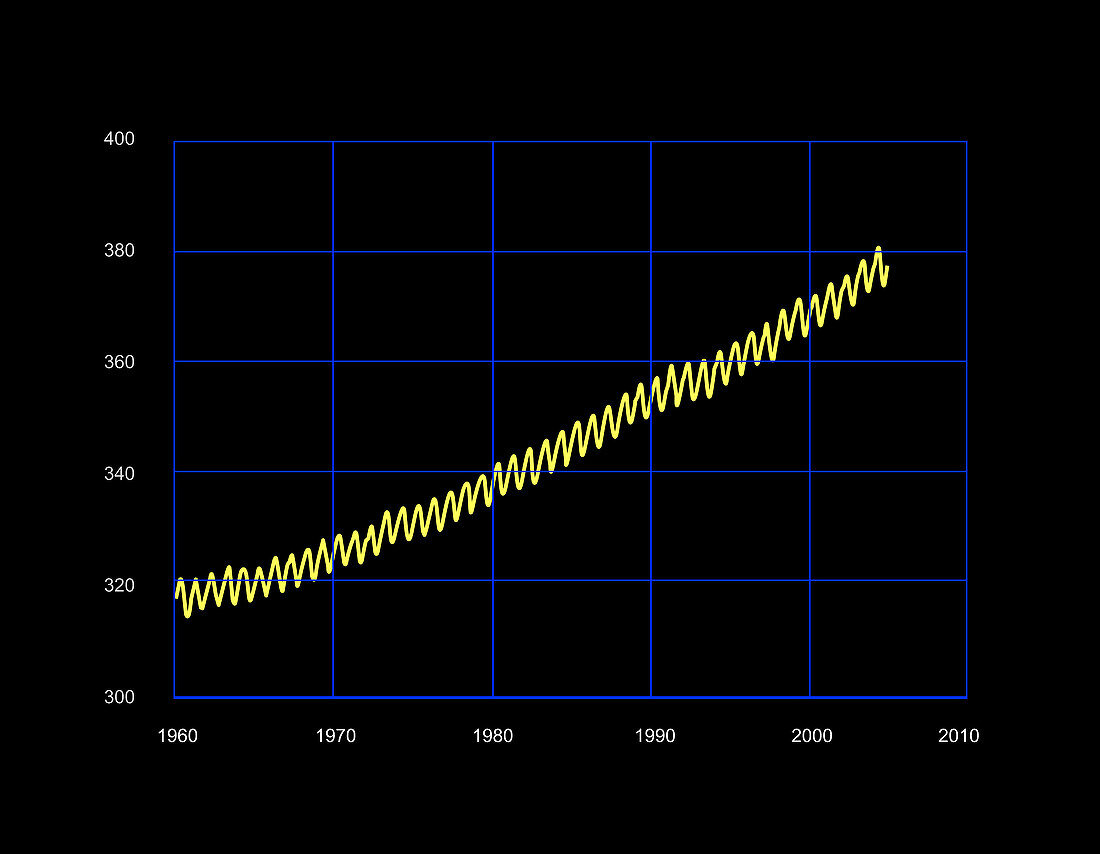
| Greenhouse Effect research. The "Keeling Curve",a graph showing the rising concentration of atmospheric carbon dioxide (CO2,measured in parts per million,vertical axis) in the years 1958-2005 (horizontal axis),as measured 4170 metres up on Mauna Loa,Hawaii. The graph reveals the steady rise of CO2 levels in the atmosphere each year due to increasing fossil fuel consumption. The regular wobbles reflect seasonal plant growth in the spring and decay in the autumn each year. This graph is named after Charles Keeling (see image H411/046),the US scientist who discovered the trend. CO2 is the main "greenhouse gas",thought to cause global warming | |
| Lizenzart: | Lizenzpflichtig |
| Credit: | Science Photo Library |
| Bildgröße: | 4927 px × 3823 px |
| Modell-Rechte: | nicht erforderlich |
| Eigentums-Rechte: | nicht erforderlich |
| Restrictions: | - |
Preise für dieses Bild ab 15 €
Universitäten & Organisationen
(Informationsmaterial Digital, Informationsmaterial Print, Lehrmaterial Digital etc.)
ab 15 €
Redaktionell
(Bücher, Bücher: Sach- und Fachliteratur, Digitale Medien (redaktionell) etc.)
ab 30 €
Werbung
(Anzeigen, Aussenwerbung, Digitale Medien, Fernsehwerbung, Karten, Werbemittel, Zeitschriften etc.)
ab 55 €
Handelsprodukte
(bedruckte Textilie, Kalender, Postkarte, Grußkarte, Verpackung etc.)
ab 75 €
Pauschalpreise
Rechtepakete für die unbeschränkte Bildnutzung in Print oder Online
ab 495 €