Global lightning distribution
Bildnummer 11736450
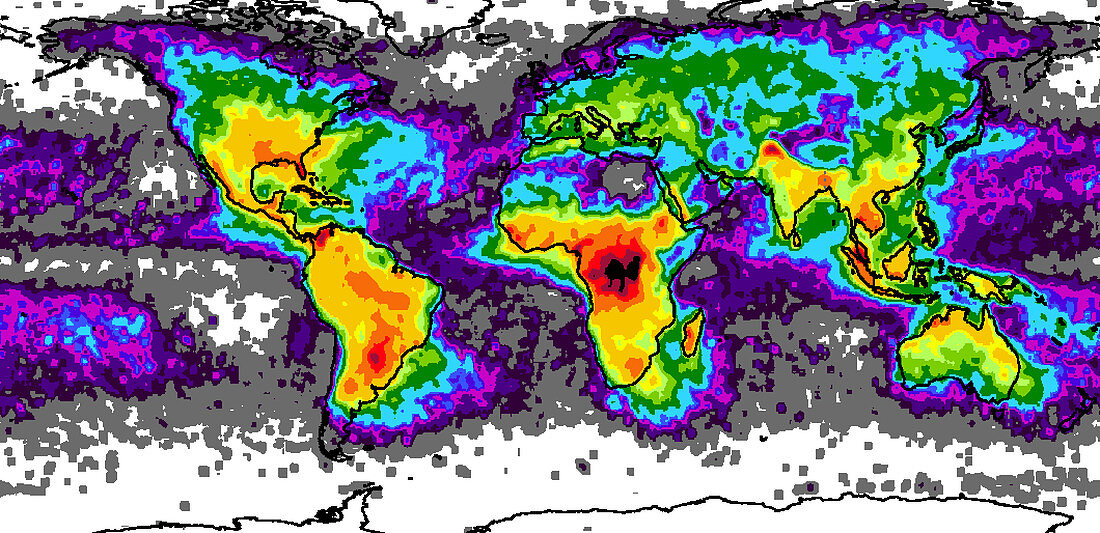
| Global lightning distribution based on satellite data of variation in the average annual lightning strike frequency per square kilometre over the Earth's surface. Frequency varies from red/orange (high) through yellow,green,blue,purple and grey to white (low). The data was collected by two sensors on satellites in low-Earth orbit,the Optical Transient Detector (OTD) and the Lightning Imaging Sensor (LIS). Measuring lightning-induced near-infrared changes in clouds revealed lightning "hotspots",including Florida,USA (upper left),Central Africa (centre) and the Himalayas (upper right). Map compiled by scientists at the National Space Science and Technology Center,USA | |
| Lizenzart: | Lizenzpflichtig |
| Credit: | Science Photo Library / NASA |
| Bildgröße: | 3180 px × 1542 px |
| Modell-Rechte: | nicht erforderlich |
| Eigentums-Rechte: | nicht erforderlich |
| Restrictions: | - |
Preise für dieses Bild ab 15 €
Universitäten & Organisationen
(Informationsmaterial Digital, Informationsmaterial Print, Lehrmaterial Digital etc.)
ab 15 €
Redaktionell
(Bücher, Bücher: Sach- und Fachliteratur, Digitale Medien (redaktionell) etc.)
ab 30 €
Werbung
(Anzeigen, Aussenwerbung, Digitale Medien, Fernsehwerbung, Karten, Werbemittel, Zeitschriften etc.)
ab 55 €
Handelsprodukte
(bedruckte Textilie, Kalender, Postkarte, Grußkarte, Verpackung etc.)
ab 75 €
Pauschalpreise
Rechtepakete für die unbeschränkte Bildnutzung in Print oder Online
ab 495 €
Keywords
- abgebildet,
- alljährlich,
- Amerikanisch,
- Ausbreitung,
- Bild,
- Bildgebung,
- Distribution,
- Durschnitt,
- Erde,
- Erdkunde,
- farbig,
- Forschung,
- Ganze,
- Gewitter,
- Hotspot,
- infrarot,
- ir,
- Karte,
- Karten,
- Klima,
- klimatisch,
- Kontinent,
- Kontinente,
- Land,
- Meer,
- Meteorologie,
- meteorologisch,
- Ozean,
- Ozeane,
- Sturm,
- Stürme,
- USA,
- Welt,
- Weltall,
- weltweit,
- Wetter,
- Wissenschaften,
- Zentrum