Ozone hole 2000
Bildnummer 11736365
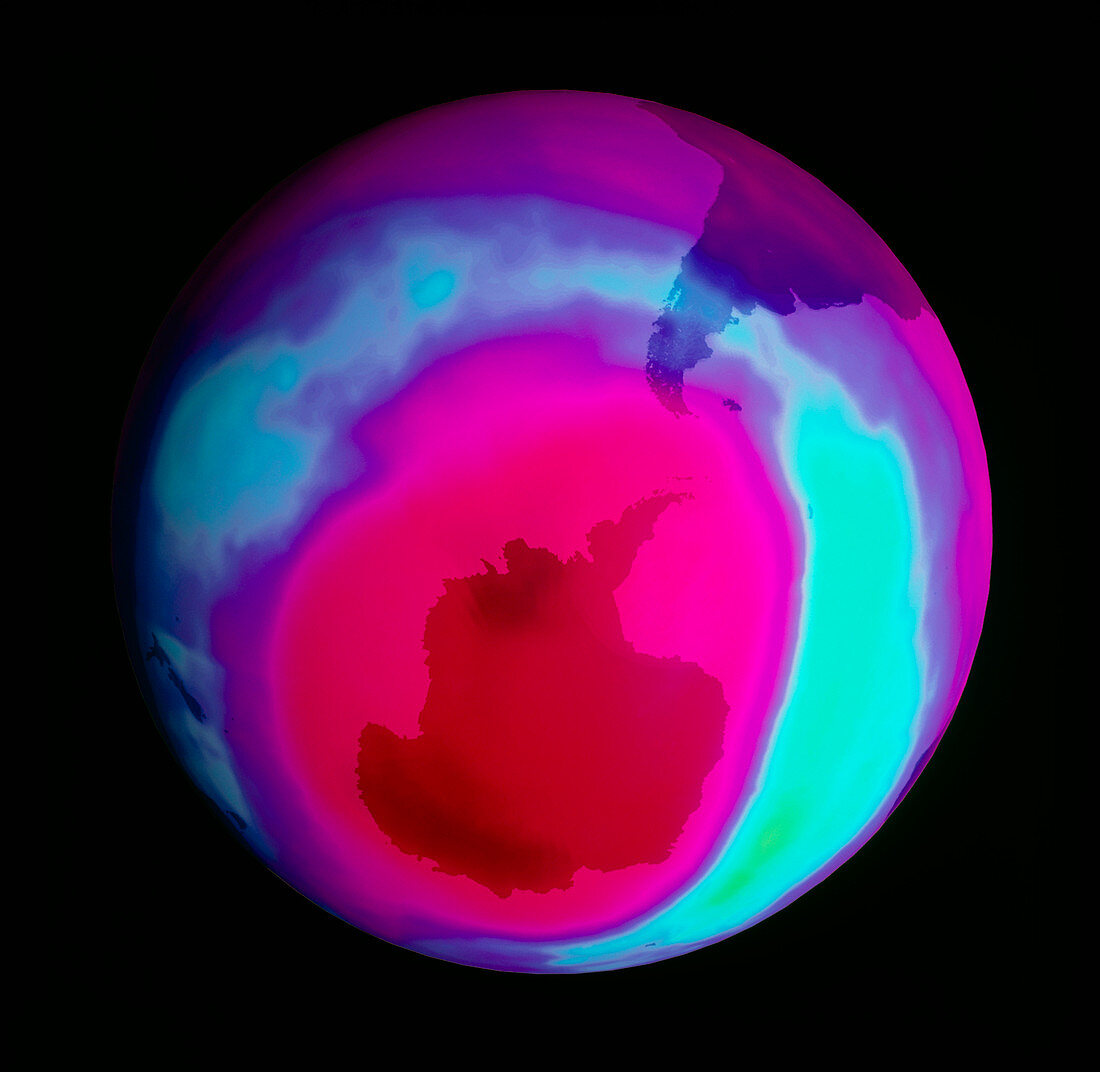
| Antarctic ozone depletion. Coloured satellite map of atmospheric ozone in the southern hemisphere on September 6,2000. The ozone hole (pale red) over Antarctica (dark red) is at its 2000 maximum of 11 million square miles. The ozone layer's thick- ness is measured in Dobson Units (DU) with 300 being an average figure. The map is colour-coded: green to cyan (300-340 DU),dark blue to magenta (200-280 DU) and red (100-200 DU). The ozone hole is due to atmospheric pollution by halogen compou- nds from halons like CFCs (chlorofluorocarbons). It is greatest around October during the Antarctic spring. Data from the TOMS (Total Ozone Mapping Spectrometer) instrument on the TOMS-EP satellite | |
| Lizenzart: | Lizenzpflichtig |
| Credit: | Science Photo Library / NASA |
| Bildgröße: | 4370 px × 4257 px |
| Modell-Rechte: | nicht erforderlich |
| Eigentums-Rechte: | nicht erforderlich |
| Restrictions: | - |
Preise für dieses Bild ab 15 €
Universitäten & Organisationen
(Informationsmaterial Digital, Informationsmaterial Print, Lehrmaterial Digital etc.)
ab 15 €
Redaktionell
(Bücher, Bücher: Sach- und Fachliteratur, Digitale Medien (redaktionell) etc.)
ab 30 €
Werbung
(Anzeigen, Aussenwerbung, Digitale Medien, Fernsehwerbung, Karten, Werbemittel, Zeitschriften etc.)
ab 55 €
Handelsprodukte
(bedruckte Textilie, Kalender, Postkarte, Grußkarte, Verpackung etc.)
ab 75 €
Pauschalpreise
Rechtepakete für die unbeschränkte Bildnutzung in Print oder Online
ab 495 €