Nimbus 7 TOMS Ozone Map of Antarctica,Oct 5 1989
Bildnummer 11736297
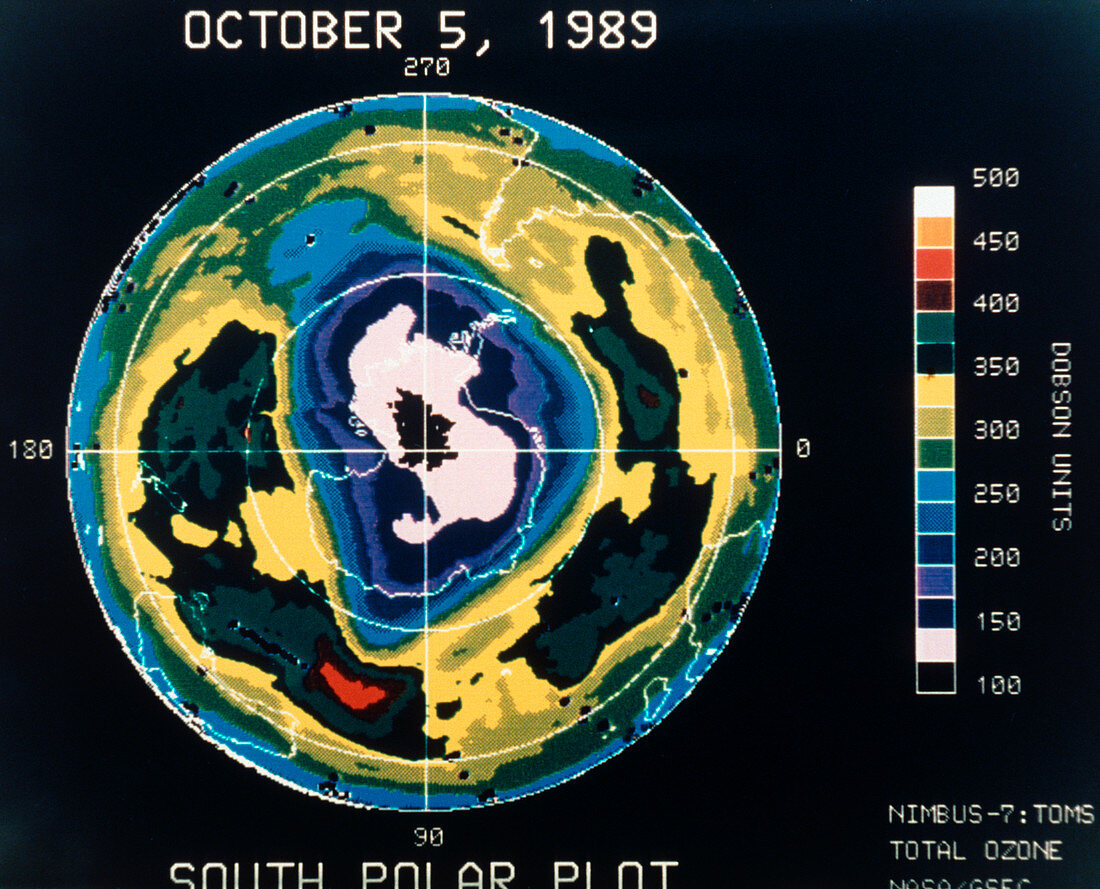
| Satellite map showing a severe depletion or "hole" in the ozone layer over Antarctica on October 5th,1989. The hole is probably due to pollution of the atmosphere by chlorofluorocarbons used in aerosols & refrigerants. First observed in 1980,the most severe depletion was recorded in October 1987. It reaches a maximum in October,the Antarctic spring. It is visible here as the pink and purple areas covering Antarctica (outlined in white) & beyond. The colours represent Dobson units,a measure of atmospheric ozone,as shown in the colour scale at right. The map was made by the Total Ozone Mapping Spectrometer (TOMS) on the American Nimbus-7 weather satellite | |
| Lizenzart: | Lizenzpflichtig |
| Credit: | Science Photo Library / NASA |
| Bildgröße: | 3972 px × 3209 px |
| Modell-Rechte: | nicht erforderlich |
| Eigentums-Rechte: | nicht erforderlich |
| Restrictions: | - |
Preise für dieses Bild ab 15 €
Universitäten & Organisationen
(Informationsmaterial Digital, Informationsmaterial Print, Lehrmaterial Digital etc.)
ab 15 €
Redaktionell
(Bücher, Bücher: Sach- und Fachliteratur, Digitale Medien (redaktionell) etc.)
ab 30 €
Werbung
(Anzeigen, Aussenwerbung, Digitale Medien, Fernsehwerbung, Karten, Werbemittel, Zeitschriften etc.)
ab 55 €
Handelsprodukte
(bedruckte Textilie, Kalender, Postkarte, Grußkarte, Verpackung etc.)
ab 75 €
Pauschalpreise
Rechtepakete für die unbeschränkte Bildnutzung in Print oder Online
ab 495 €