Ocean surface CO2 and winds,global map
Bildnummer 11729219
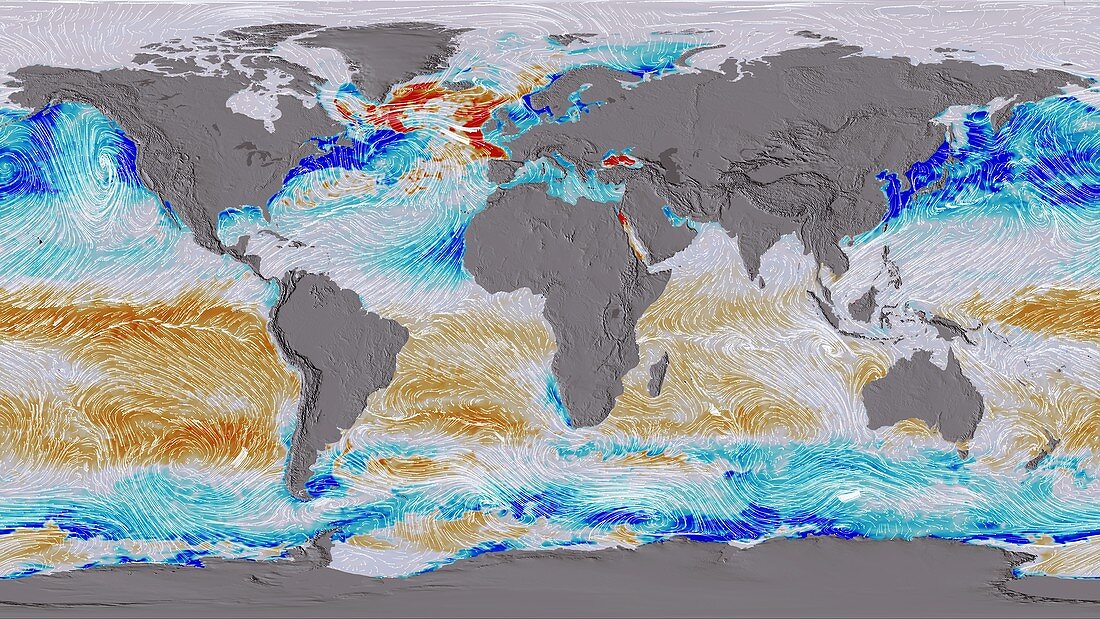
| Ocean surface CO2 and winds,global map. This map,centred on Africa,is from an animation that shows the ocean surface carbon dioxide (CO2) flux in 2009 and 2010. Blue colours indicate uptake and orange-red colours indicate out-gassing of ocean carbon. The pathlines indicate surface wind stress,one of the drivers of air-sea carbon exchange. Studying this process aids understanding of the carbon cycle,carbon biogeochemistry,and climate change. These results are from the ECCO2-Darwin ocean carbon cycle model,part of the Carbon Monitoring System (CMS) Flux Project. This image shows data from 1 March 2009 | |
| Lizenzart: | Lizenzpflichtig |
| Credit: | Science Photo Library / NASA's Scientific Visualization Studio / NASA |
| Bildgröße: | 5634 px × 3169 px |
| Modell-Rechte: | nicht erforderlich |
| Eigentums-Rechte: | nicht erforderlich |
| Restrictions: | - |
Preise für dieses Bild ab 15 €
Universitäten & Organisationen
(Informationsmaterial Digital, Informationsmaterial Print, Lehrmaterial Digital etc.)
ab 15 €
Redaktionell
(Bücher, Bücher: Sach- und Fachliteratur, Digitale Medien (redaktionell) etc.)
ab 30 €
Werbung
(Anzeigen, Aussenwerbung, Digitale Medien, Fernsehwerbung, Karten, Werbemittel, Zeitschriften etc.)
ab 55 €
Handelsprodukte
(bedruckte Textilie, Kalender, Postkarte, Grußkarte, Verpackung etc.)
ab 75 €
Pauschalpreise
Rechtepakete für die unbeschränkte Bildnutzung in Print oder Online
ab 495 €
Keywords
- 21. Jahrhundert,
- Atmosphäre,
- Ausgasung,
- Erde,
- farbcodiert,
- geografisch,
- Geographie,
- Globale Erwärmung,
- Klimatologie,
- klimatologisch,
- Klimawandel,
- Kohlendioxid,
- Marine,
- Meer,
- Meereskunde,
- Meteorologie,
- meteorologisch,
- Niemand,
- Ozean,
- Planet,
- planetarisch,
- Treibhausgas,
- Umweltwissenschaften,
- weltweit,
- Wetter,
- Wind